
Guide
Monitors
This page explains how a monitor is checked and when it changes state. It is for the WHMCS administrator.
A check runs only when cron or Force Run calls it. The interval is the minimum gap between checks, not a guarantee that a check starts at that second.
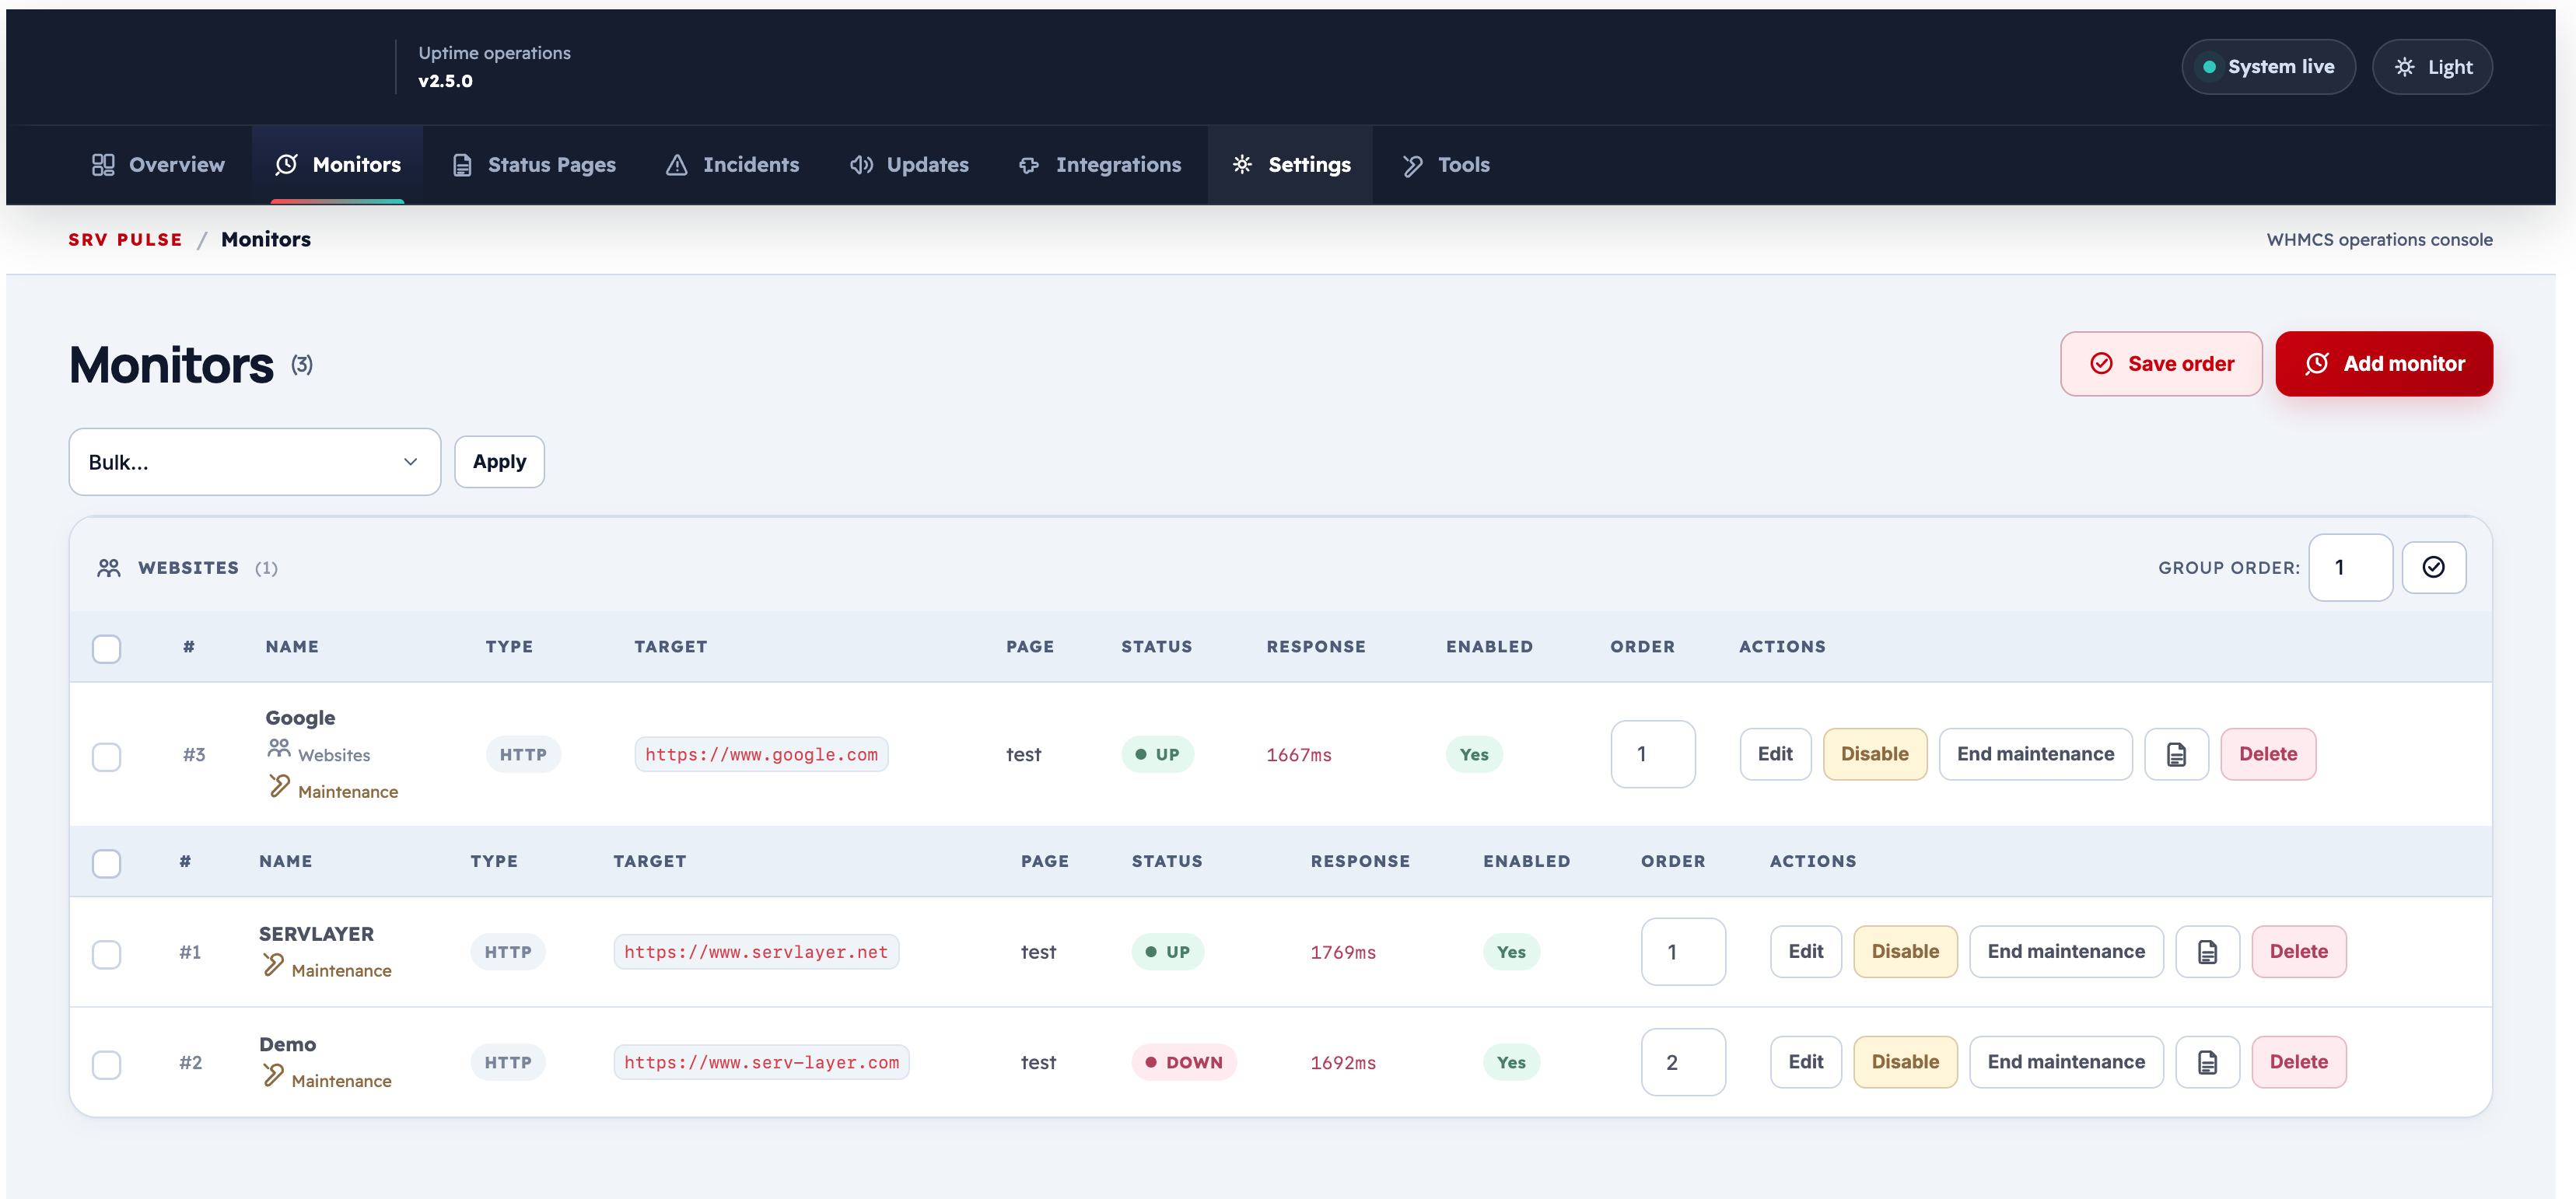
Monitor List Overview
The Monitors tab shows all configured monitors with:
- Current status badge (Up / Down / Paused / Unknown)
- Last response time (milliseconds)
- Last checked timestamp
- Group name and tags
- Assigned status page
- Quick actions: Edit, Force Run, Toggle Enable/Disable, Delete
You can filter by status page, group, status, and type. Bulk actions let you enable, disable, or delete multiple monitors at once.
Adding a Monitor
Click Add Monitor to open the multi-tab monitor creation form.
Tab 1 — Basic
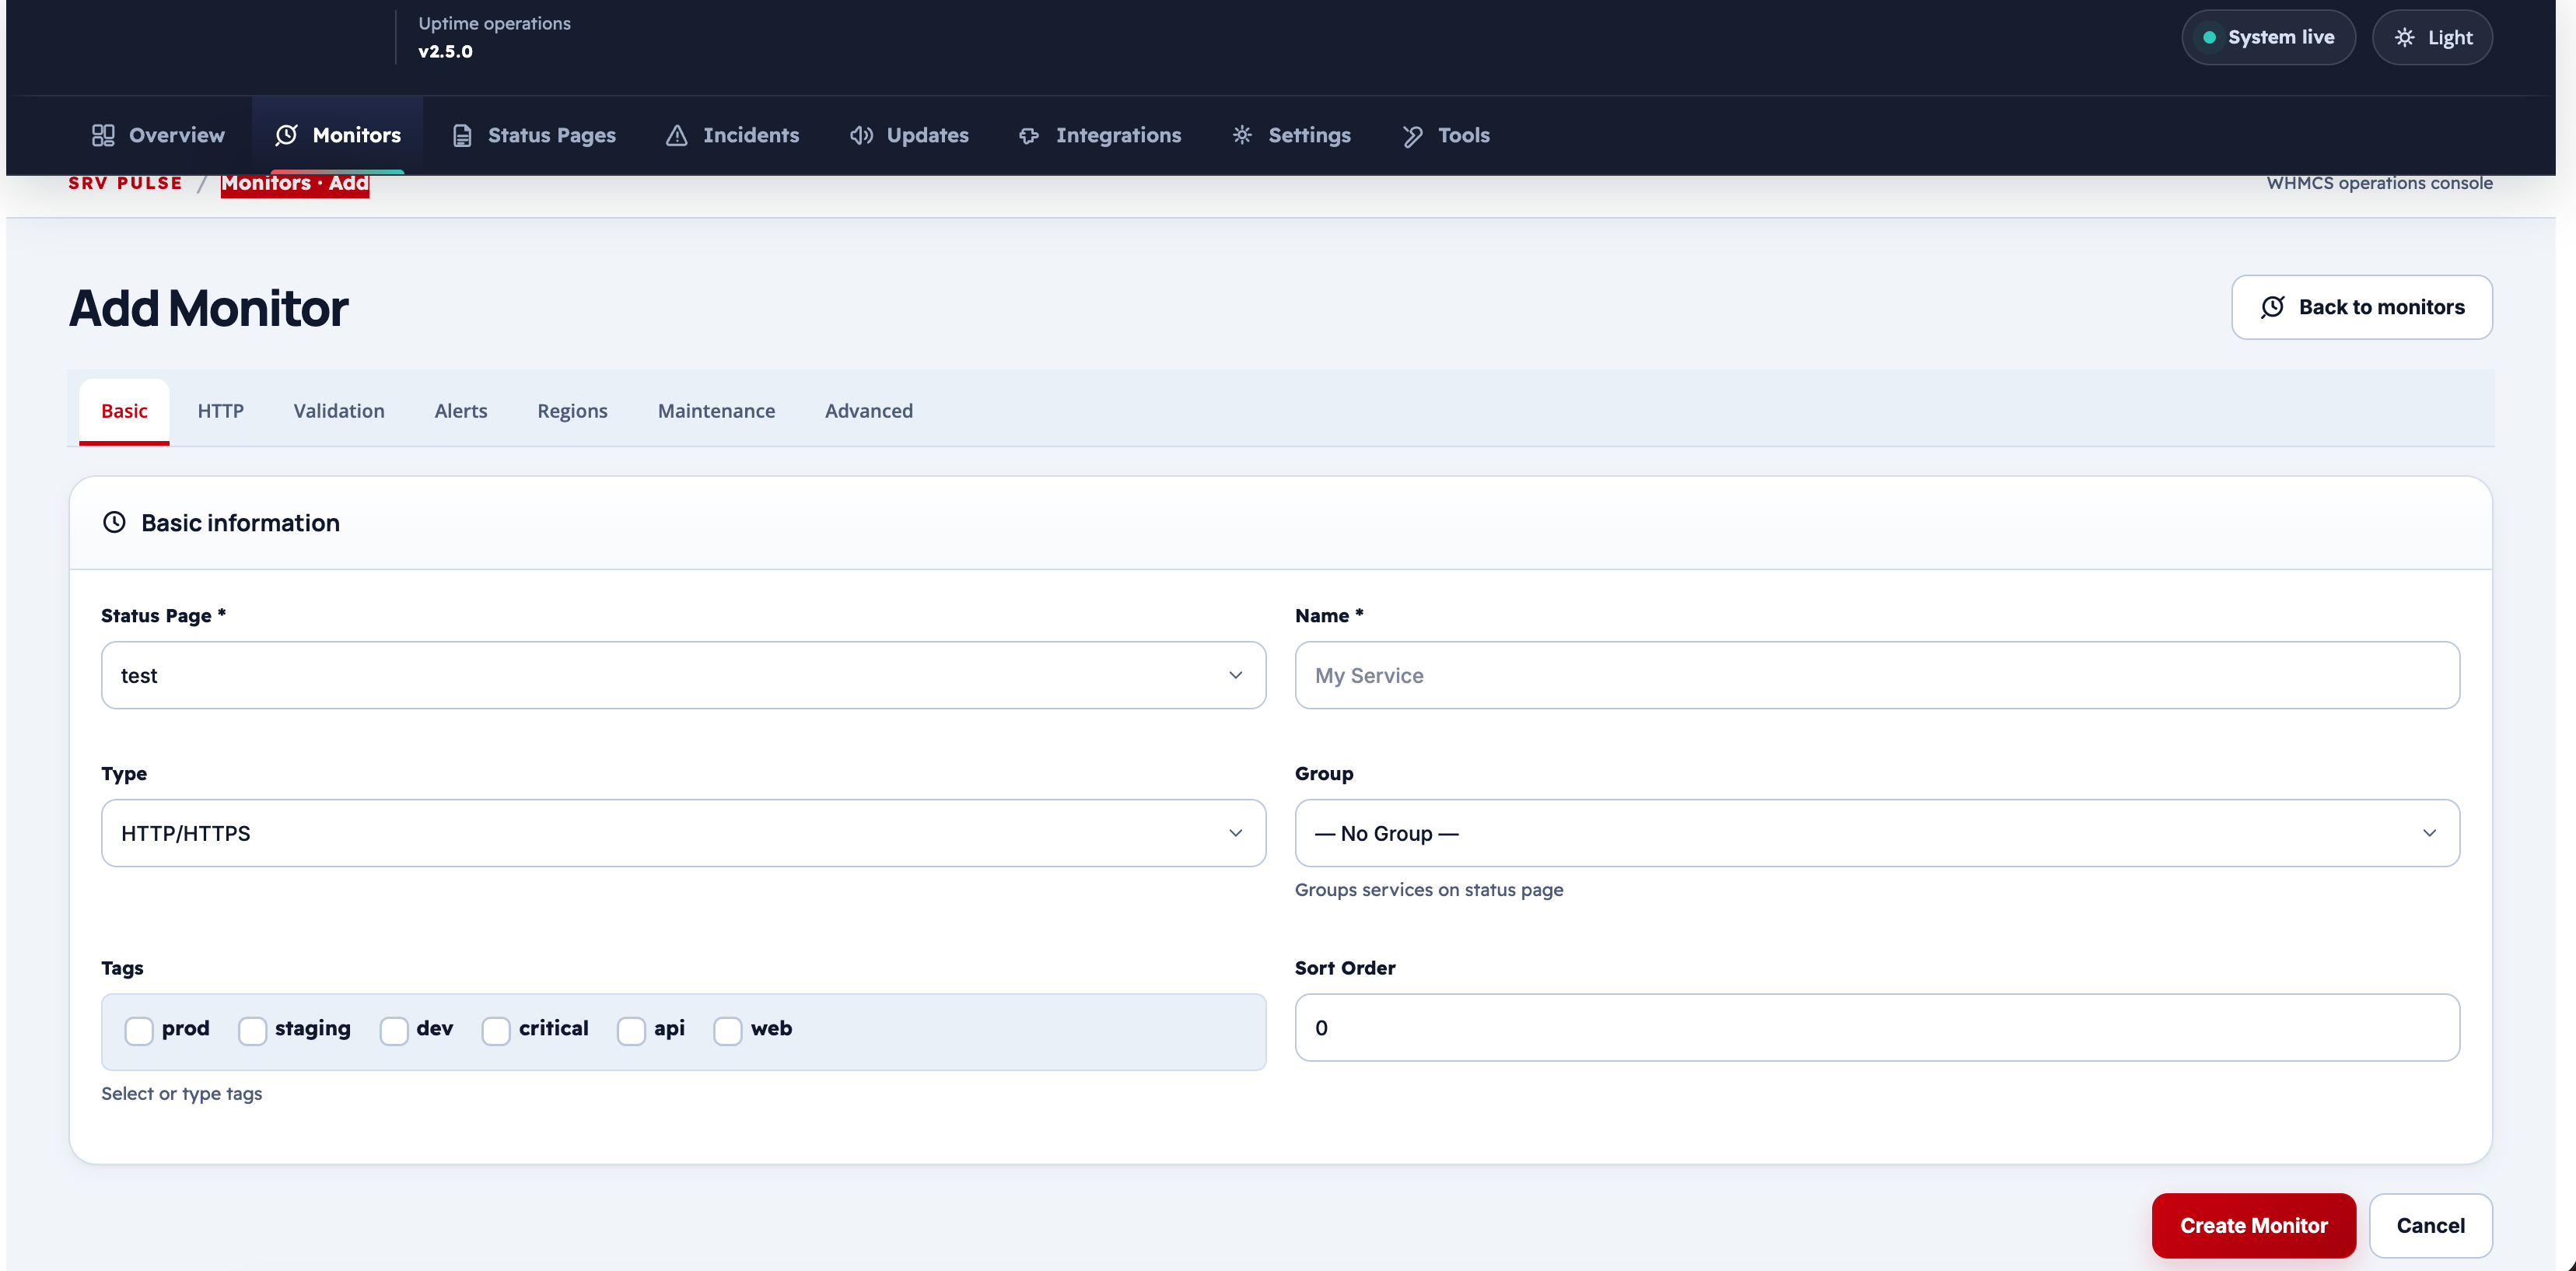
| Field | Description | Default |
|---|---|---|
| Name | Friendly display name shown on the status page | — |
| Status Page | Which status page this monitor belongs to | — |
| Group | Optional group for visual organisation on the status page | — |
| Tags | Comma-separated tags for internal filtering | — |
| Monitor Type | http, tcp, ping, or heartbeat |
http |
| Target | URL (for HTTP), hostname or IP (for TCP/Ping), or leave blank (for Heartbeat) | — |
| Enabled | Toggle to activate or pause the monitor without deleting it | On |
| Check Interval | How often to run a check, in seconds | 300 (5 min) |
| Timeout | Maximum wait time per check attempt, in seconds | 10 |
Tab 2 — HTTP Settings
Visible only for monitor type HTTP.
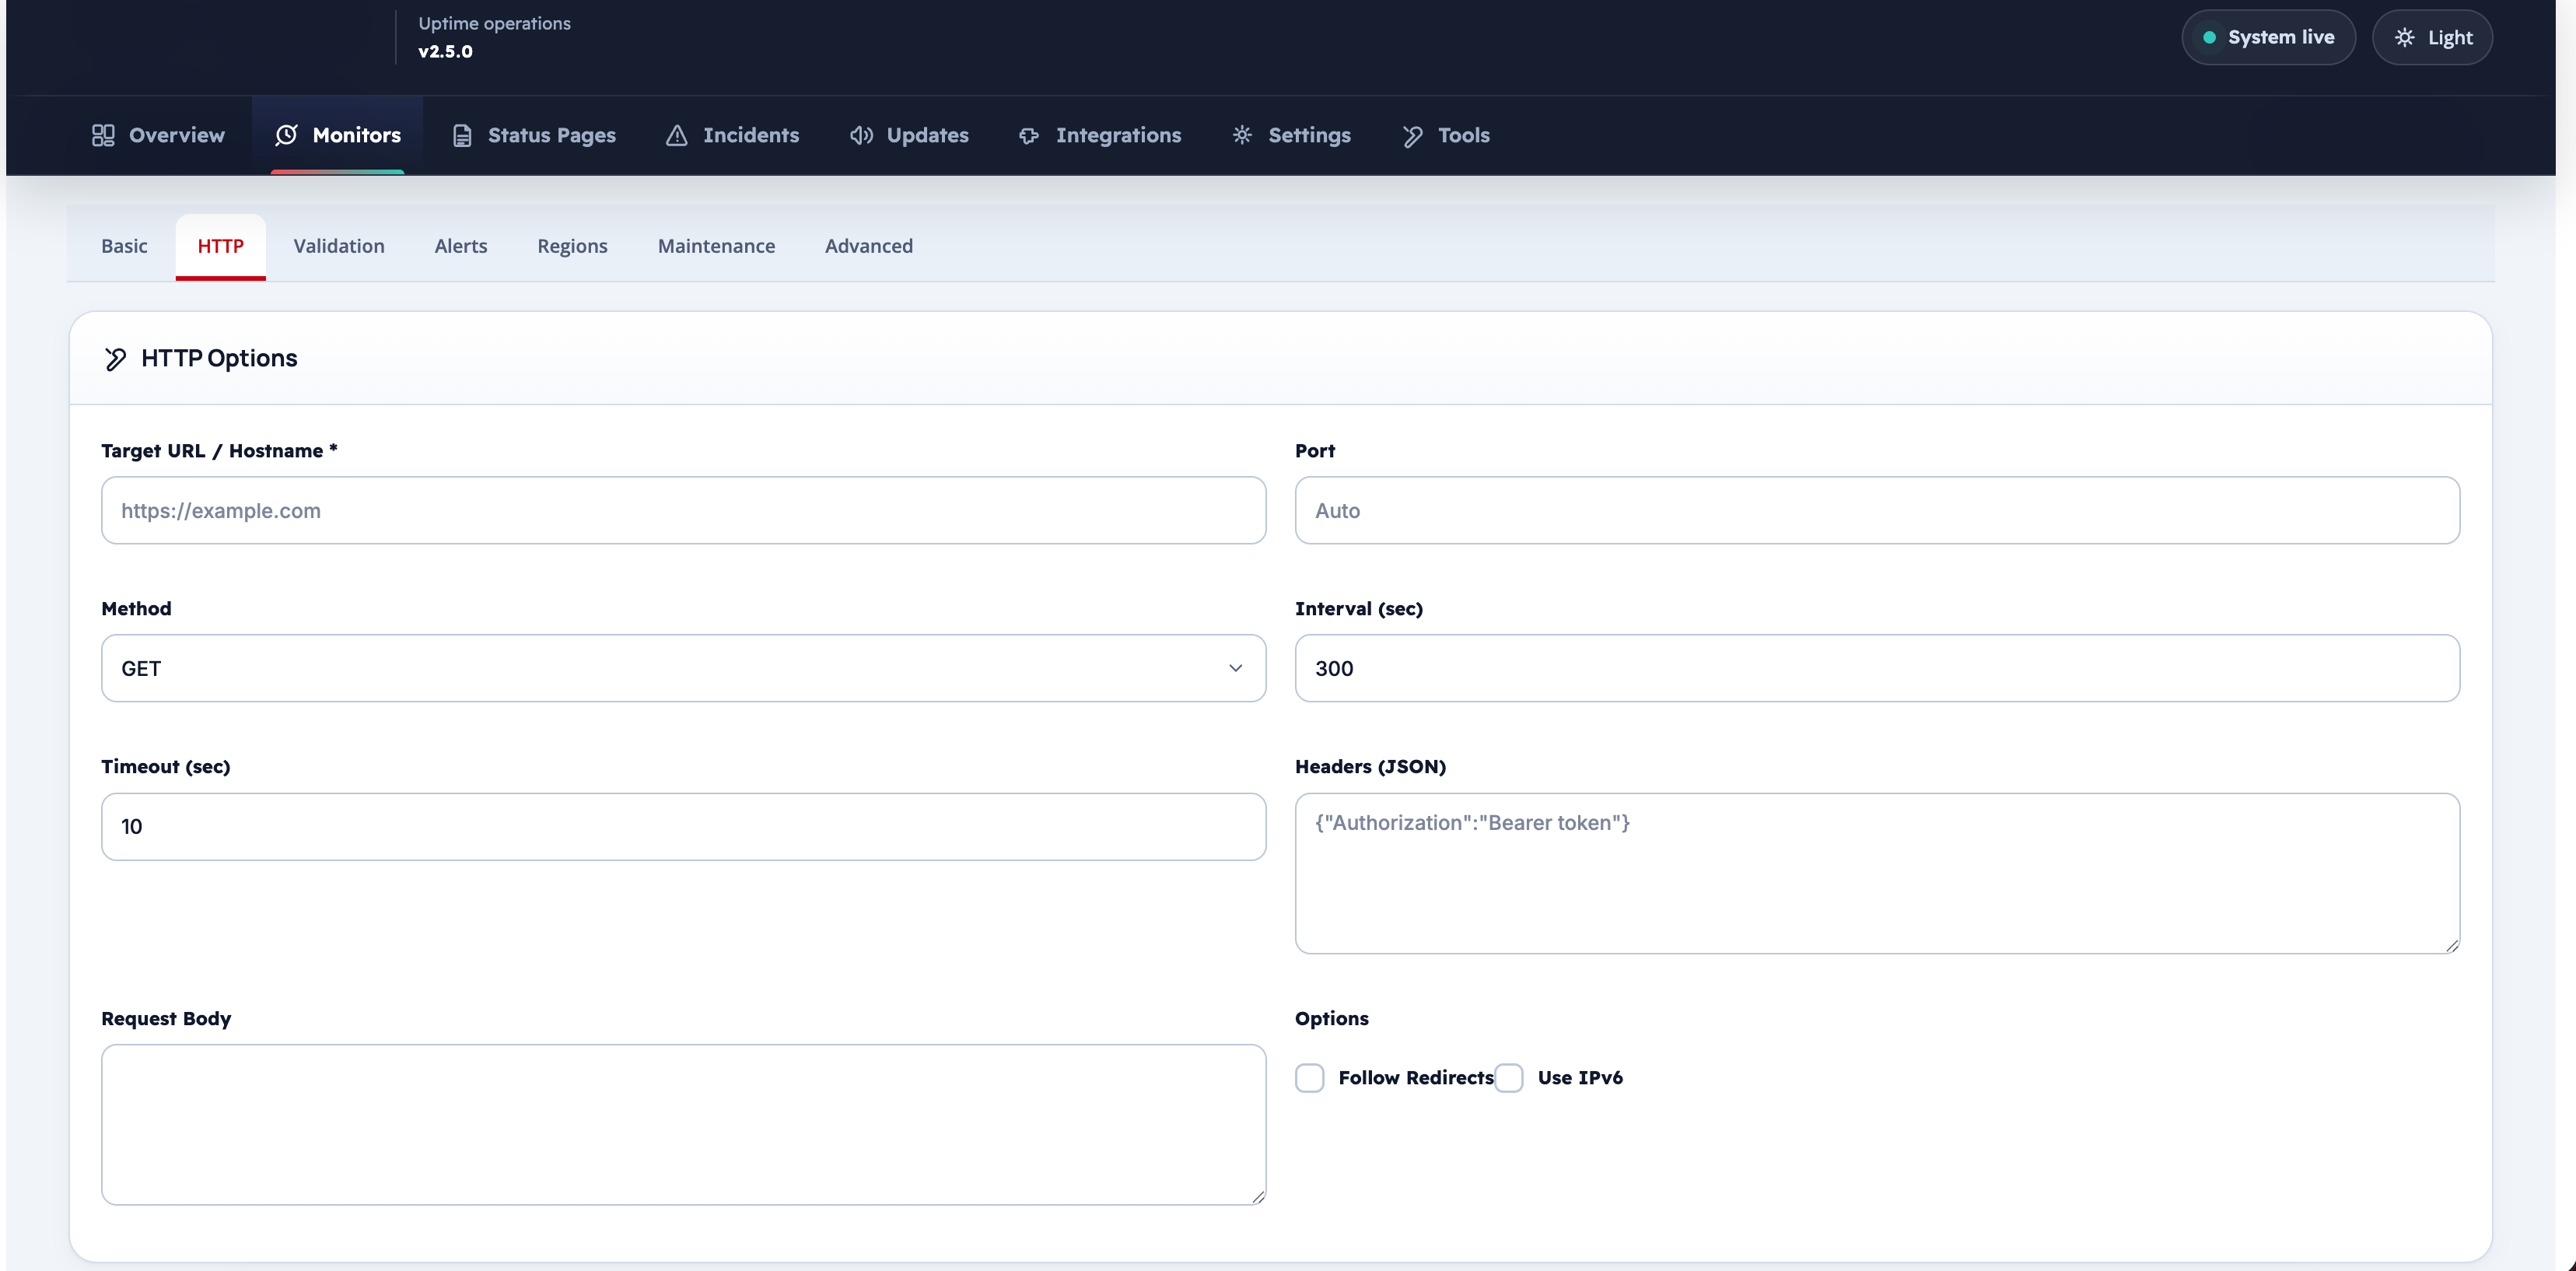
| Field | Description | Default |
|---|---|---|
| HTTP Method | GET, POST, HEAD, PUT, PATCH, DELETE |
GET |
| Request Headers | Custom headers in Name: Value format, one per line |
— |
| Request Body | Body payload for POST/PUT/PATCH requests | — |
| Follow Redirects | Whether to follow HTTP 3xx redirects | On |
| SSL Expiry Alert (days) | Warn when the SSL certificate expires within N days | 14 |
| Expected HTTP Status | Expected response code; leave blank to accept any 2xx/3xx | — |
Tab 3 — Validation
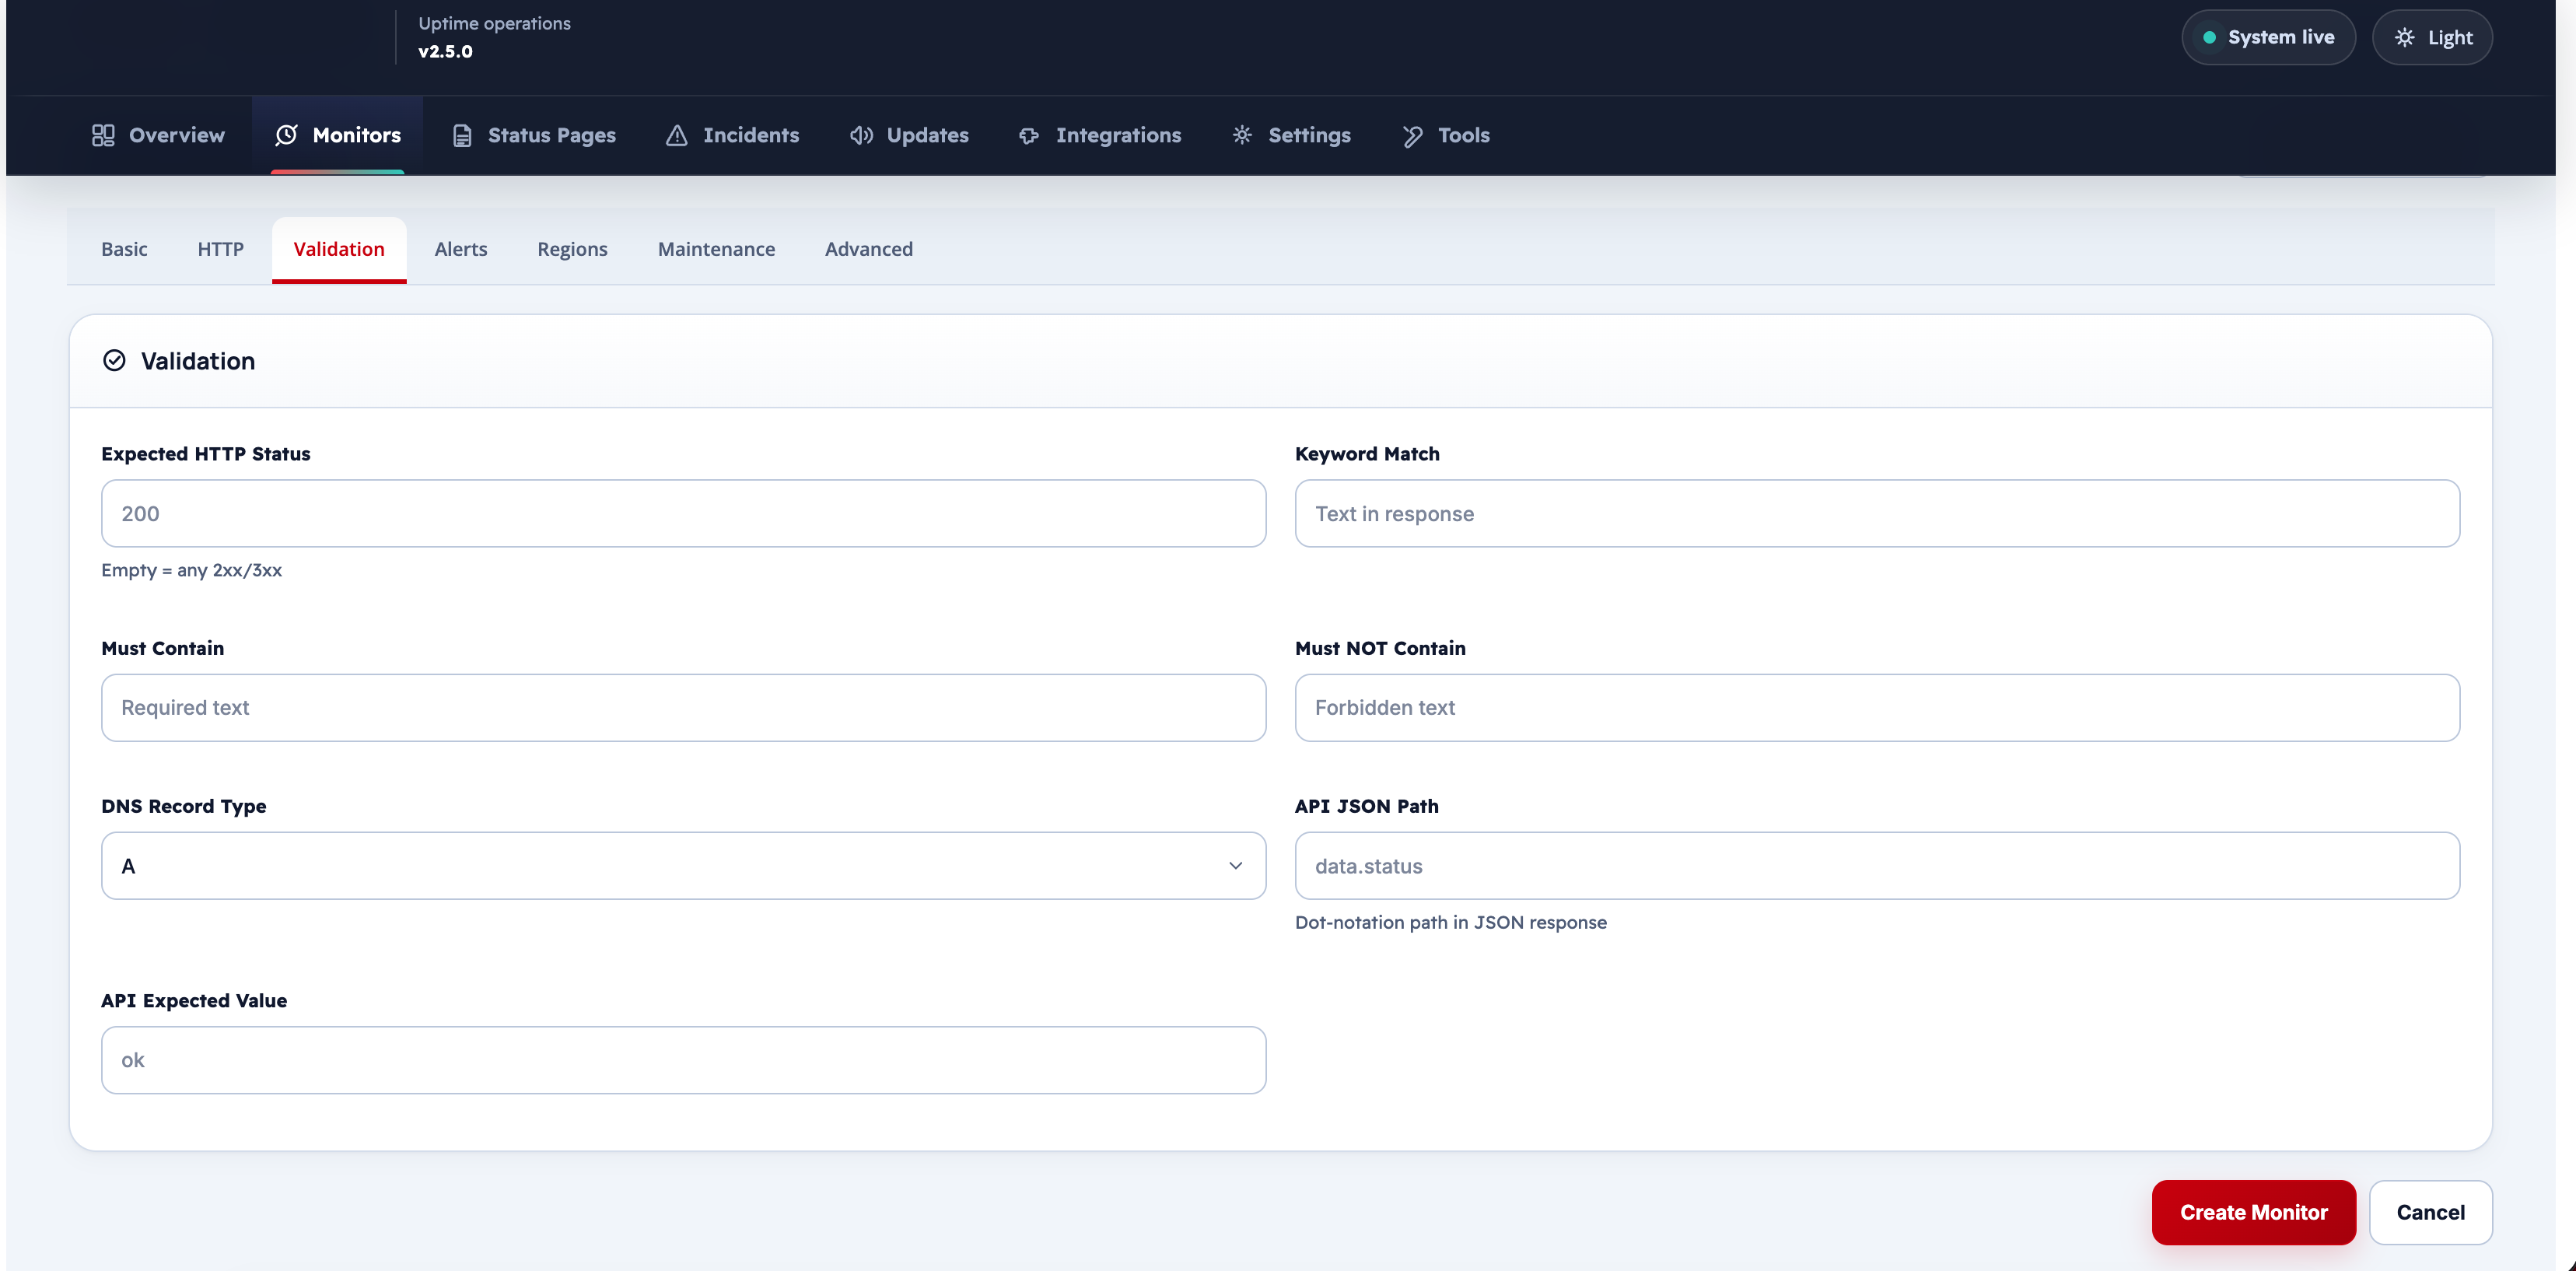
| Field | Description |
|---|---|
| Keyword (must contain) | The response body must contain this exact string for the check to pass |
| Keyword (must not contain) | The check fails if this string appears in the response body |
Both fields accept plain text. Matching is case-sensitive.
Tip
Use a keyword unique to a healthy response, such as a product name or a specific HTML element, to catch cases where the server returns 200 but the application is broken.
Tab 4 — Alerts & SLA
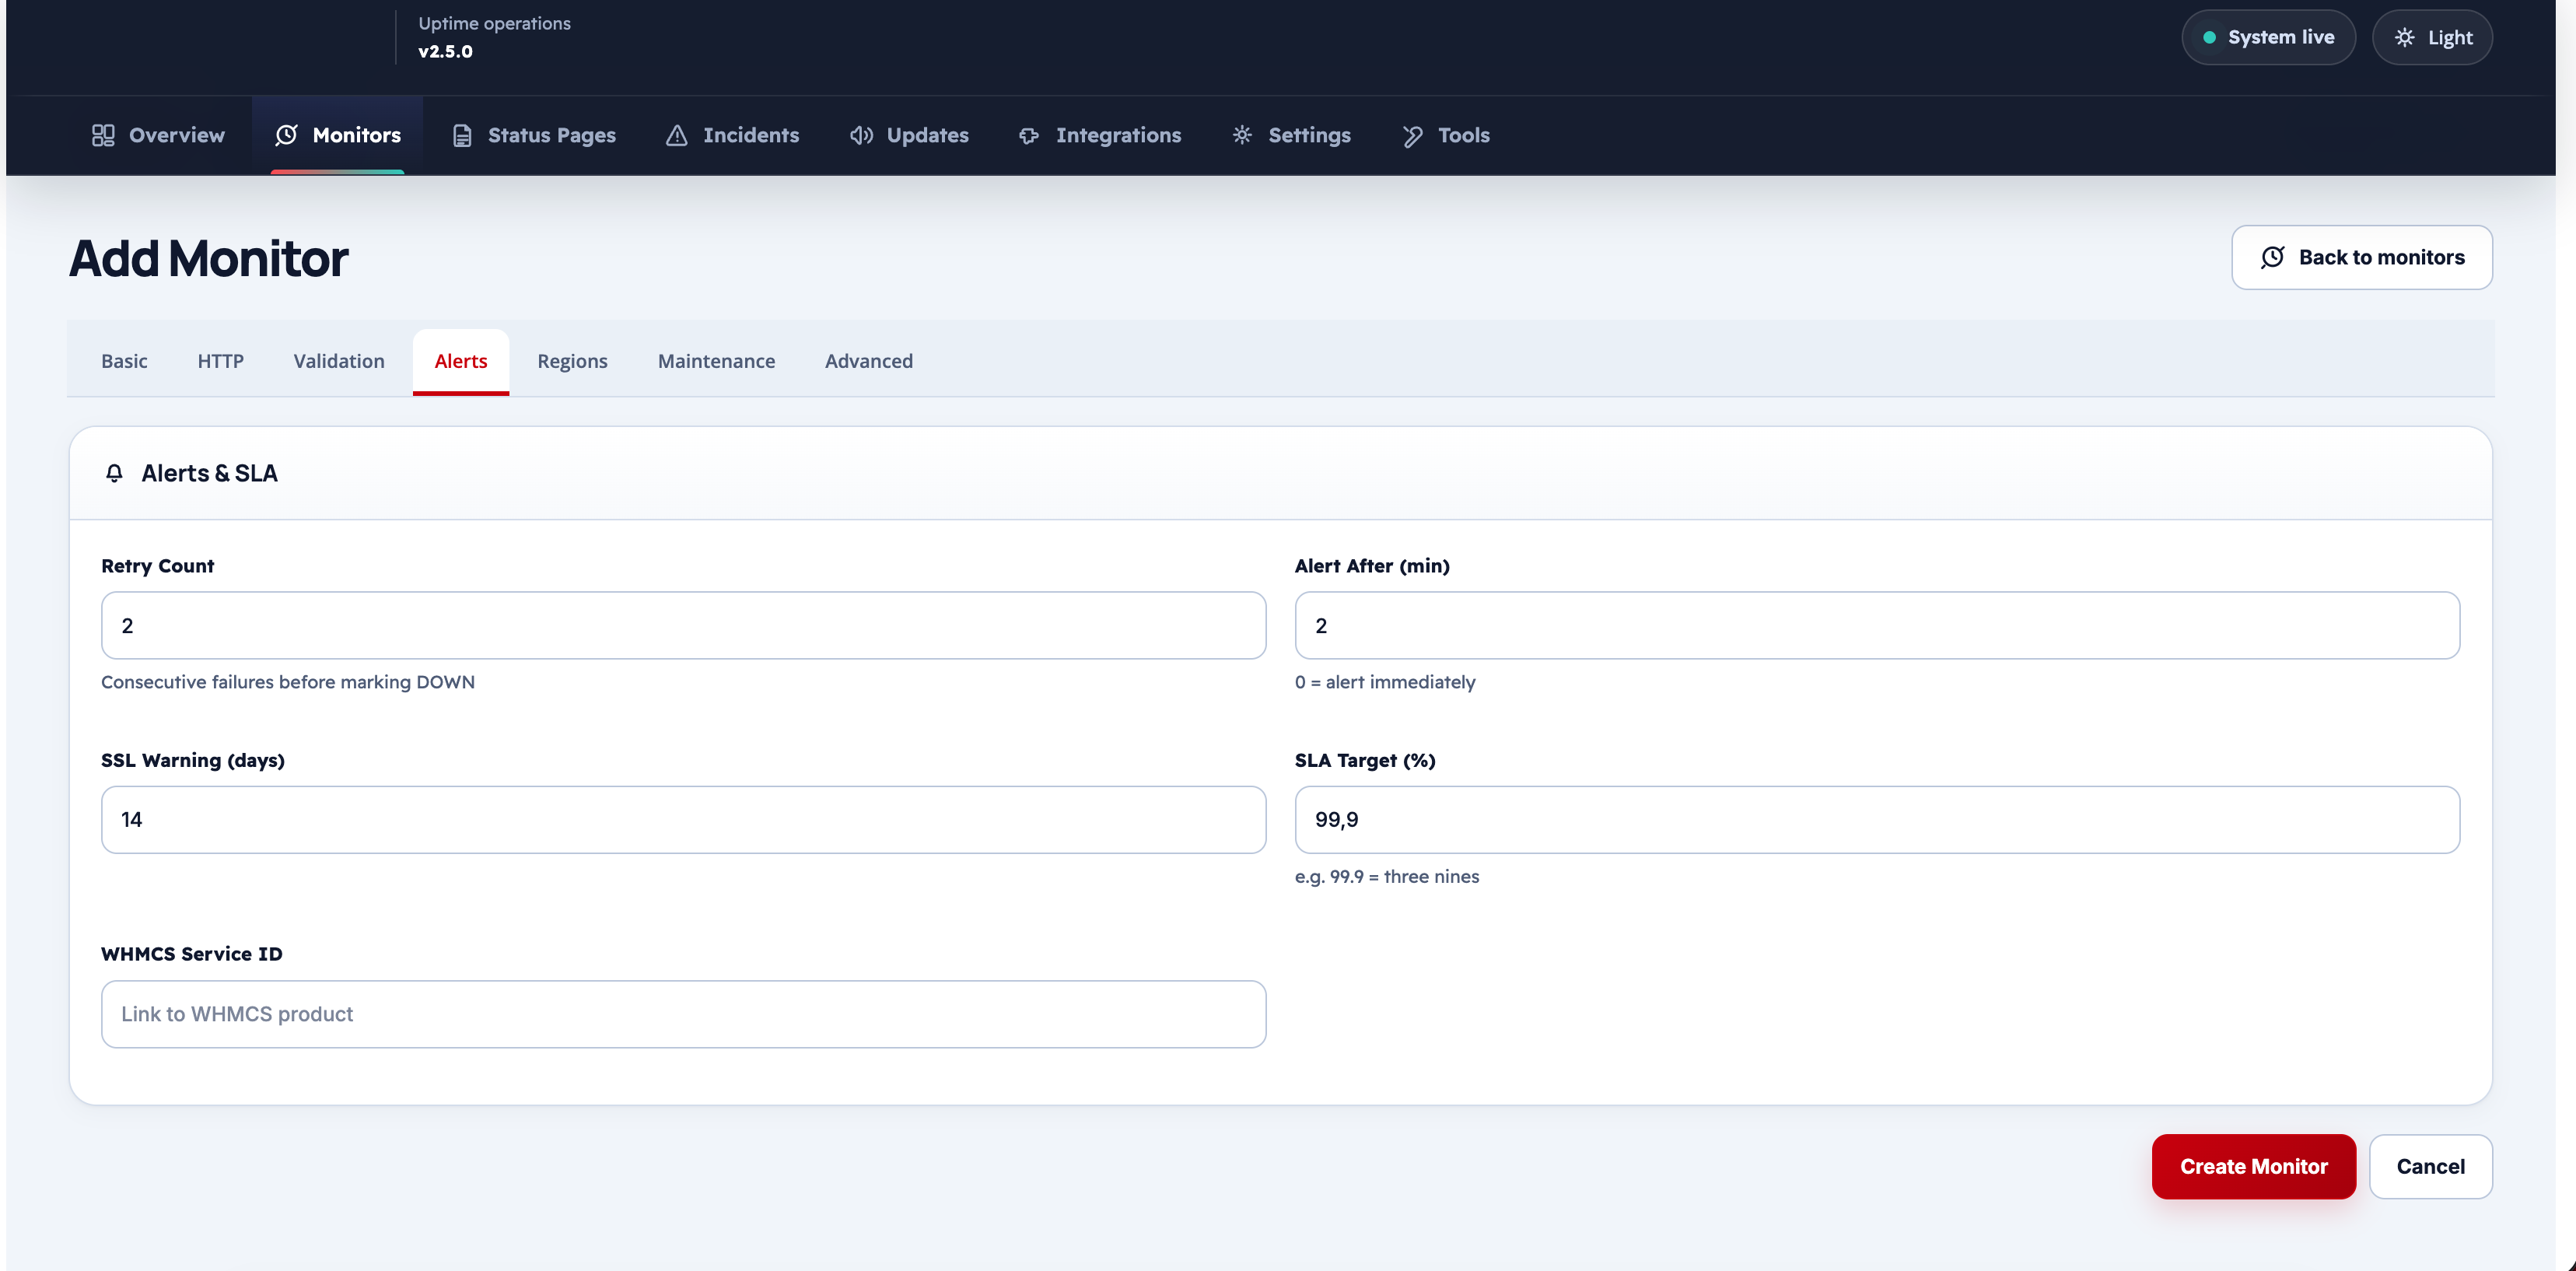
| Field | Description | Default |
|---|---|---|
| Retry Count | Number of consecutive failures before the monitor is marked as Down | 2 |
| Min Downtime Alert (minutes) | Send alerts only after the service has been down for at least N minutes | 2 |
| SLA Target (%) | Monthly uptime target used in SLA reporting | 99.9 |
| Send Notifications | Toggle email/webhook/Telegram alerts for this monitor | On |
How the retry/fail-streak works:
- A single failed check increments the internal fail streak counter.
- Only when the streak reaches the Retry Count threshold does the monitor status change to Down.
- The status reverts to Up on the first successful check.
This prevents transient network blips from triggering false alerts.
Tab 5 — Regions (Multi-Region Extension)
Visible only when the Multi-Region extension is enabled.
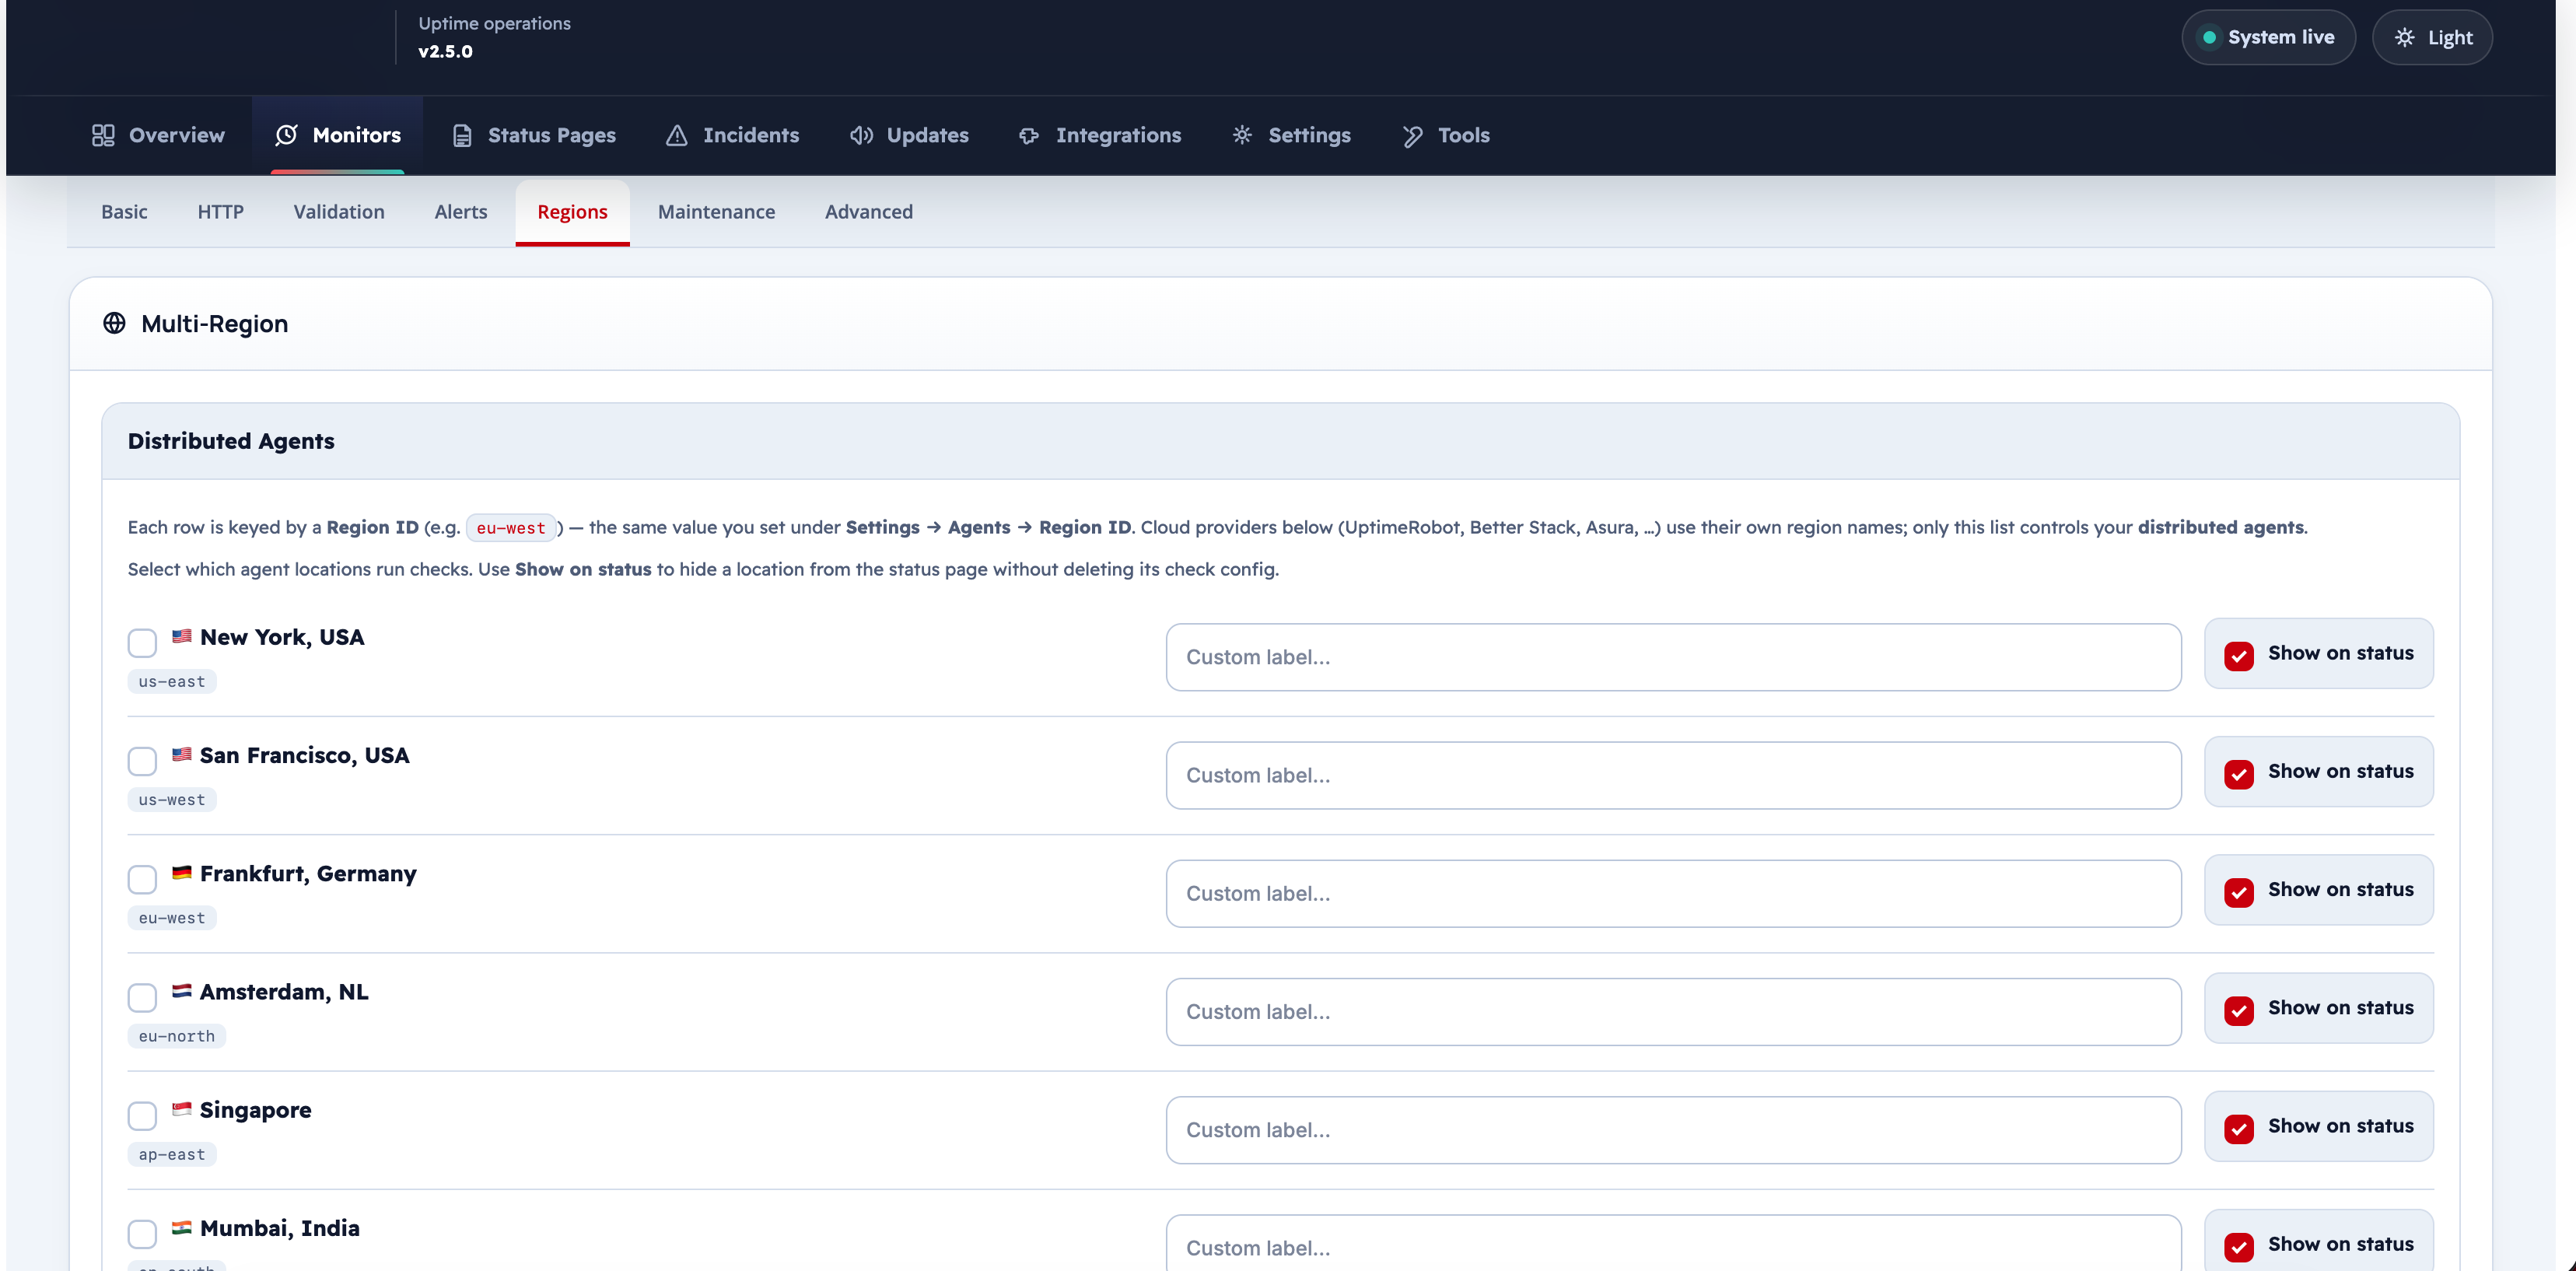
| Field | Description |
|---|---|
| Enable Multi-Region | Activates distributed checking for this monitor |
| Regions | Select which agent regions run this monitor (e.g. local, US, EU, Asia) |
| Region Provider | The monitoring service or agent type for each region (e.g. local, uptimerobot, statuscake, betterstack, asura) |
| Show Agent Results | Display individual region results on the public status page |
| Region Label | Optional display label for each region shown to visitors |
Tab 6 — Maintenance
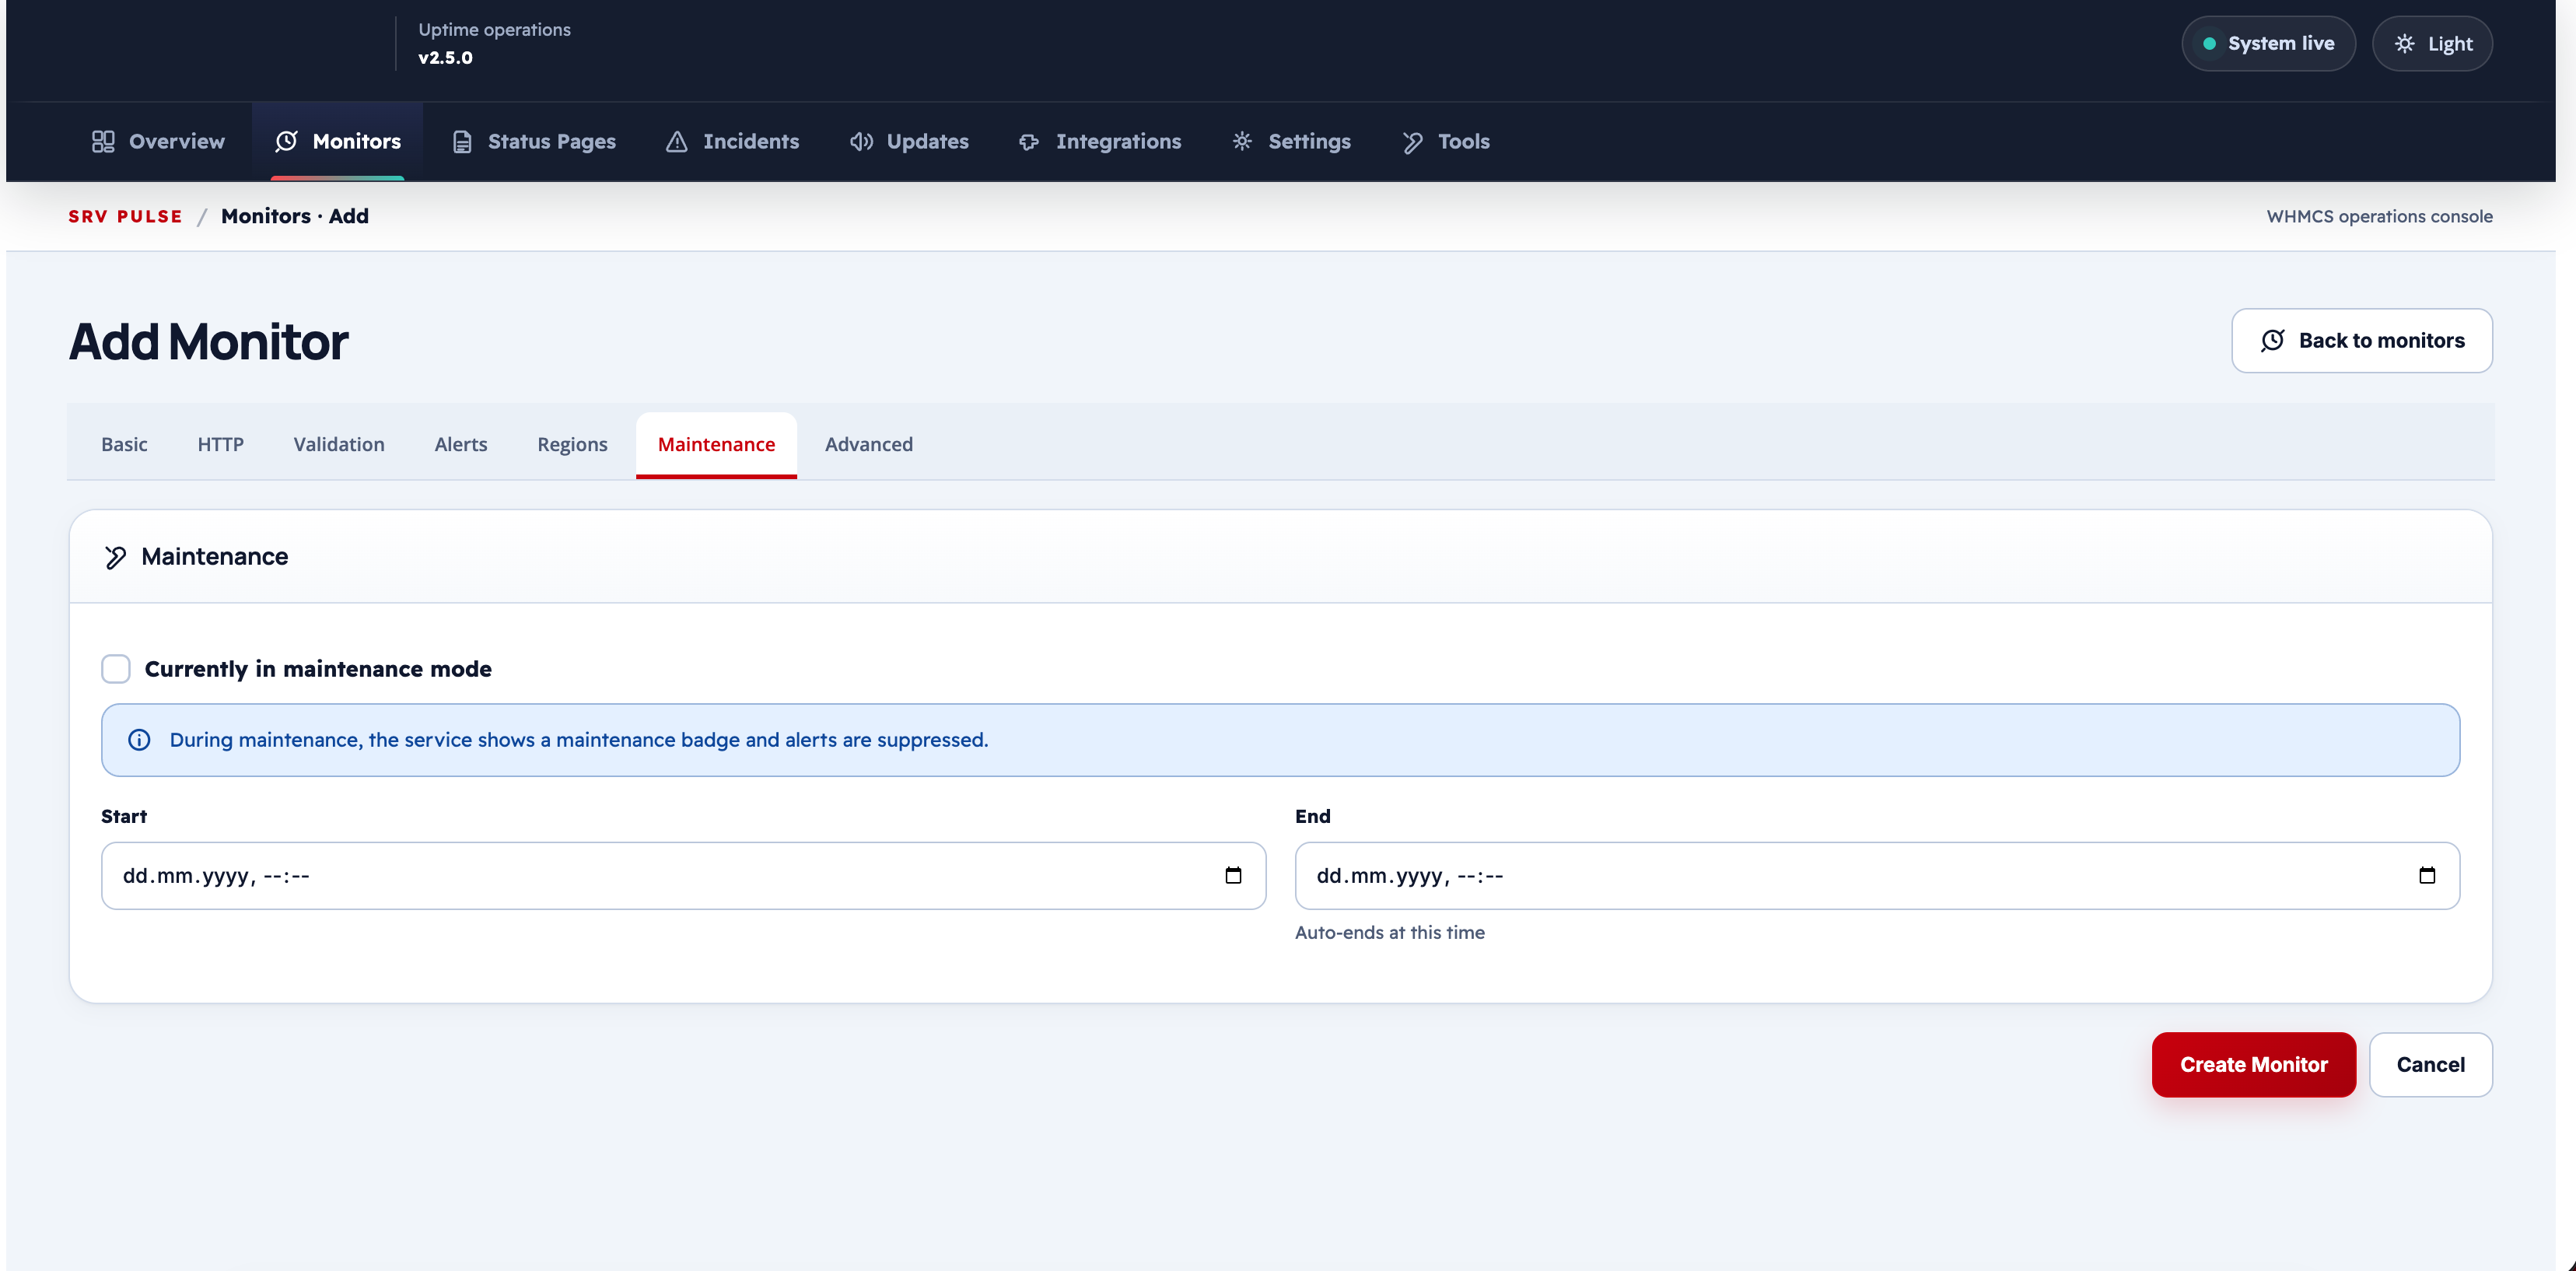
| Field | Description |
|---|---|
| In Maintenance | Manually mark the monitor as in maintenance (suppresses alerts) |
| Maintenance Start | Scheduled start datetime for planned maintenance |
| Maintenance End | Scheduled end datetime; monitor resumes normal checking after this |
During a maintenance window:
- The status page shows a "Maintenance" badge instead of Up/Down
- No alerts or notifications are sent
- Check results are still recorded
Tab 7 — Advanced
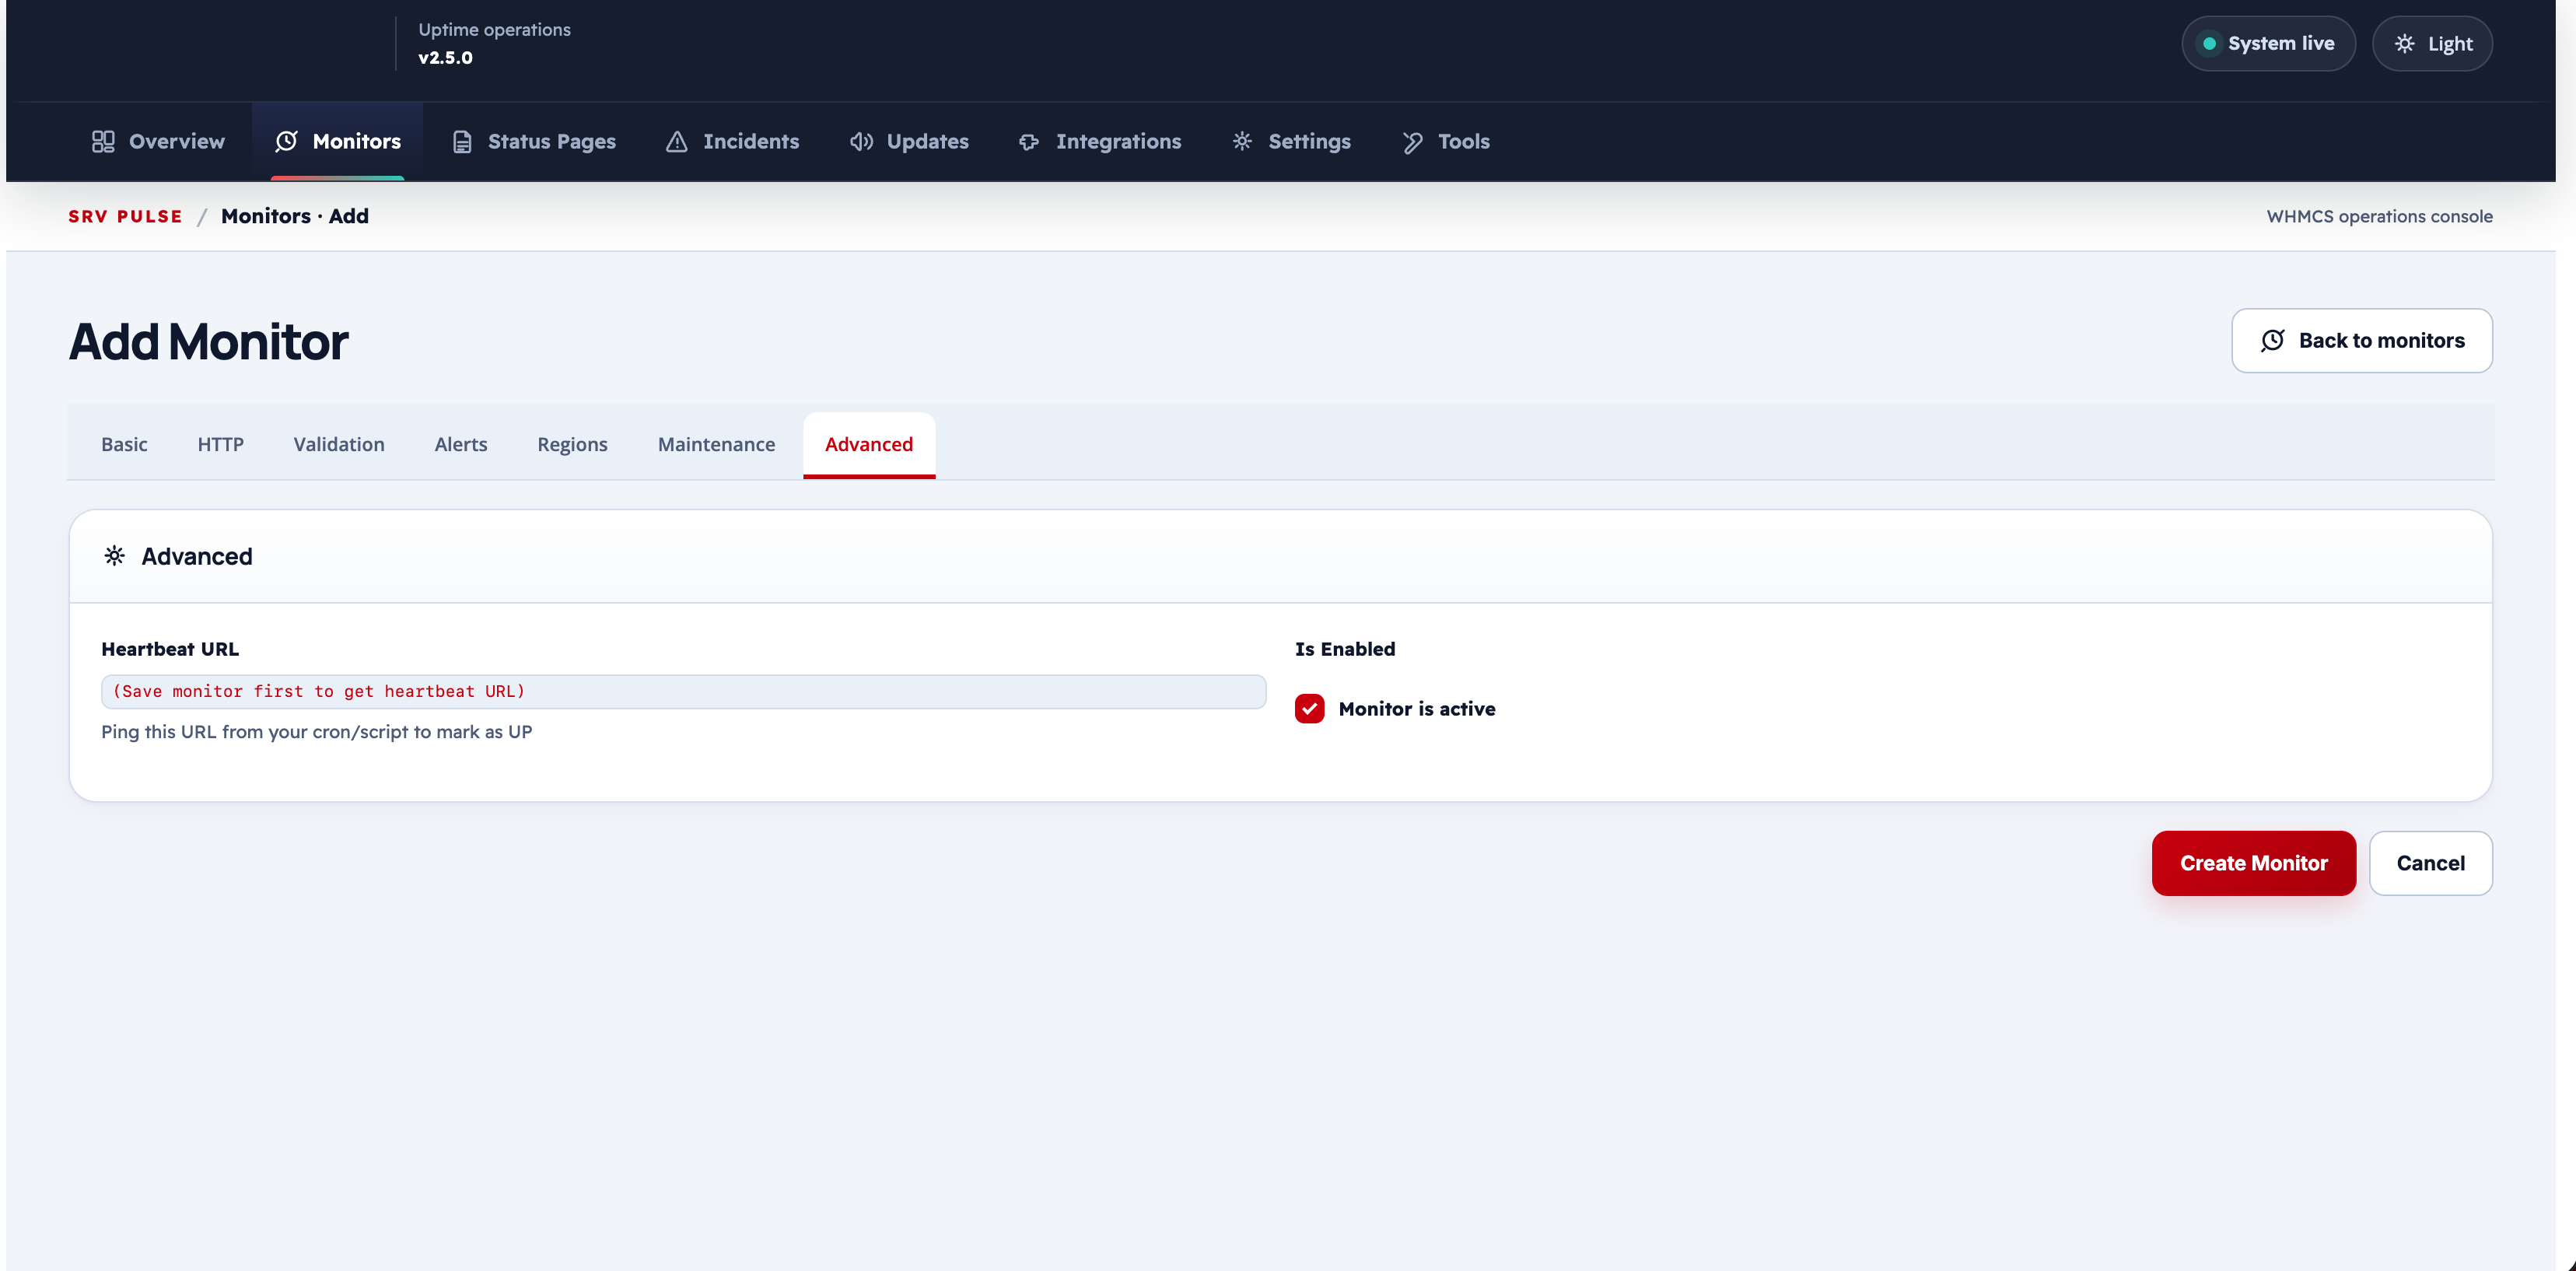
| Field | Description |
|---|---|
| Heartbeat URL | (Heartbeat monitors only) The unique URL that the service must call periodically |
| Expected Ping Interval | How often the service is expected to call the heartbeat URL (seconds) |
| WHMCS Service ID | Link this monitor to a WHMCS service for display or automation |
| Sort Order | Controls the display order of this monitor within its group on the status page |
Heartbeat monitors work in reverse: instead of the addon polling the service, the service calls a special URL. If the URL is not called within the configured interval, the monitor shows as Down.
Monitor Statuses
| Status | Meaning |
|---|---|
| Up | Last check passed; service is reachable |
| Down | Fail streak reached the retry threshold; service is unreachable |
| Paused | Monitor is disabled; no checks are running |
| Maintenance | Monitor is within a maintenance window |
| Unknown | No check has been completed yet |
Troubleshooting
| Problem | Fix |
|---|---|
| Monitor stays "Unknown" | Check that the WHMCS cron or cron URL is running |
| False Down alerts | Increase the Retry Count or Min Downtime Alert |
| SSL alert not working | Verify the target URL uses HTTPS |
| Keyword check always failing | Confirm the keyword matches the exact live response (case-sensitive) |
| Heartbeat always Down | Ensure the external service is calling the correct heartbeat URL |