
Guide
Tools and diagnostics
This page explains how to run checks now and how long results are kept. It is for the WHMCS administrator. Retention deletes rows older than the configured number of days. It does not delete monitors or incidents.
Force Run All Checks
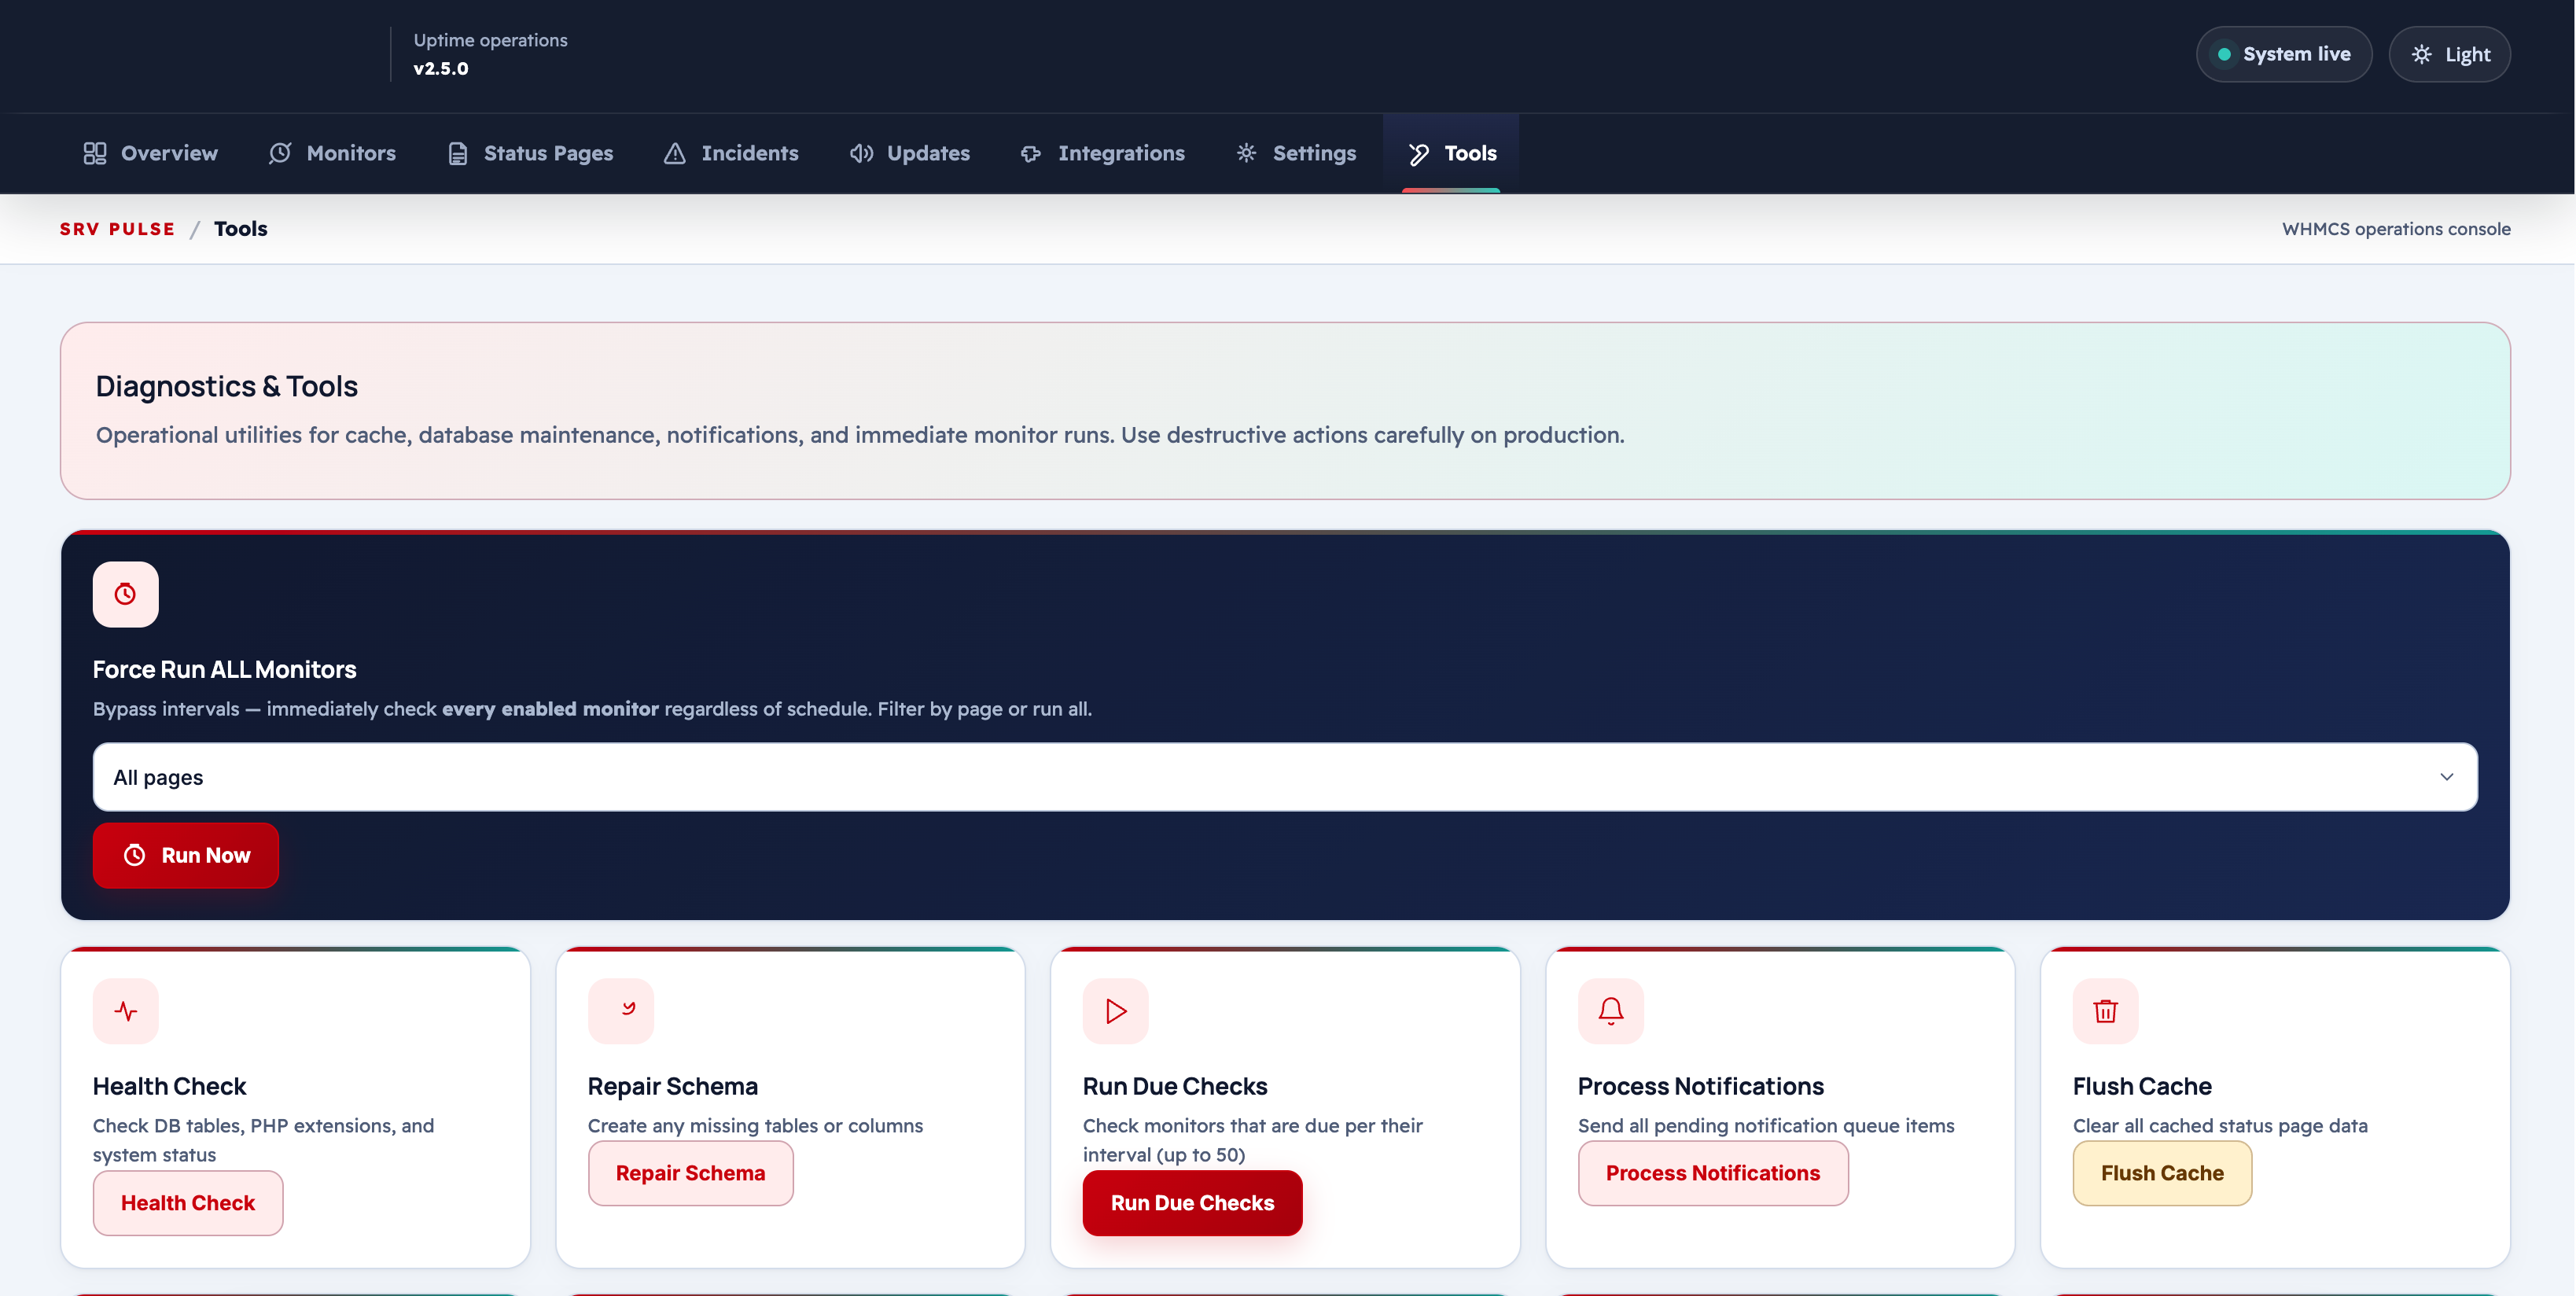
Click Force Run All Checks Now to execute a full check cycle immediately, outside of the normal cron schedule.
| Field | Description |
|---|---|
| Run All Checks | Triggers all enabled monitors to run now, regardless of their next scheduled time |
| Check a Single Monitor | Enter a monitor ID to run one specific check immediately |
Use this for:
- Verifying that a newly added monitor works
- Confirming a service has recovered after an incident
- Testing cron connectivity
Data Retention & Purge
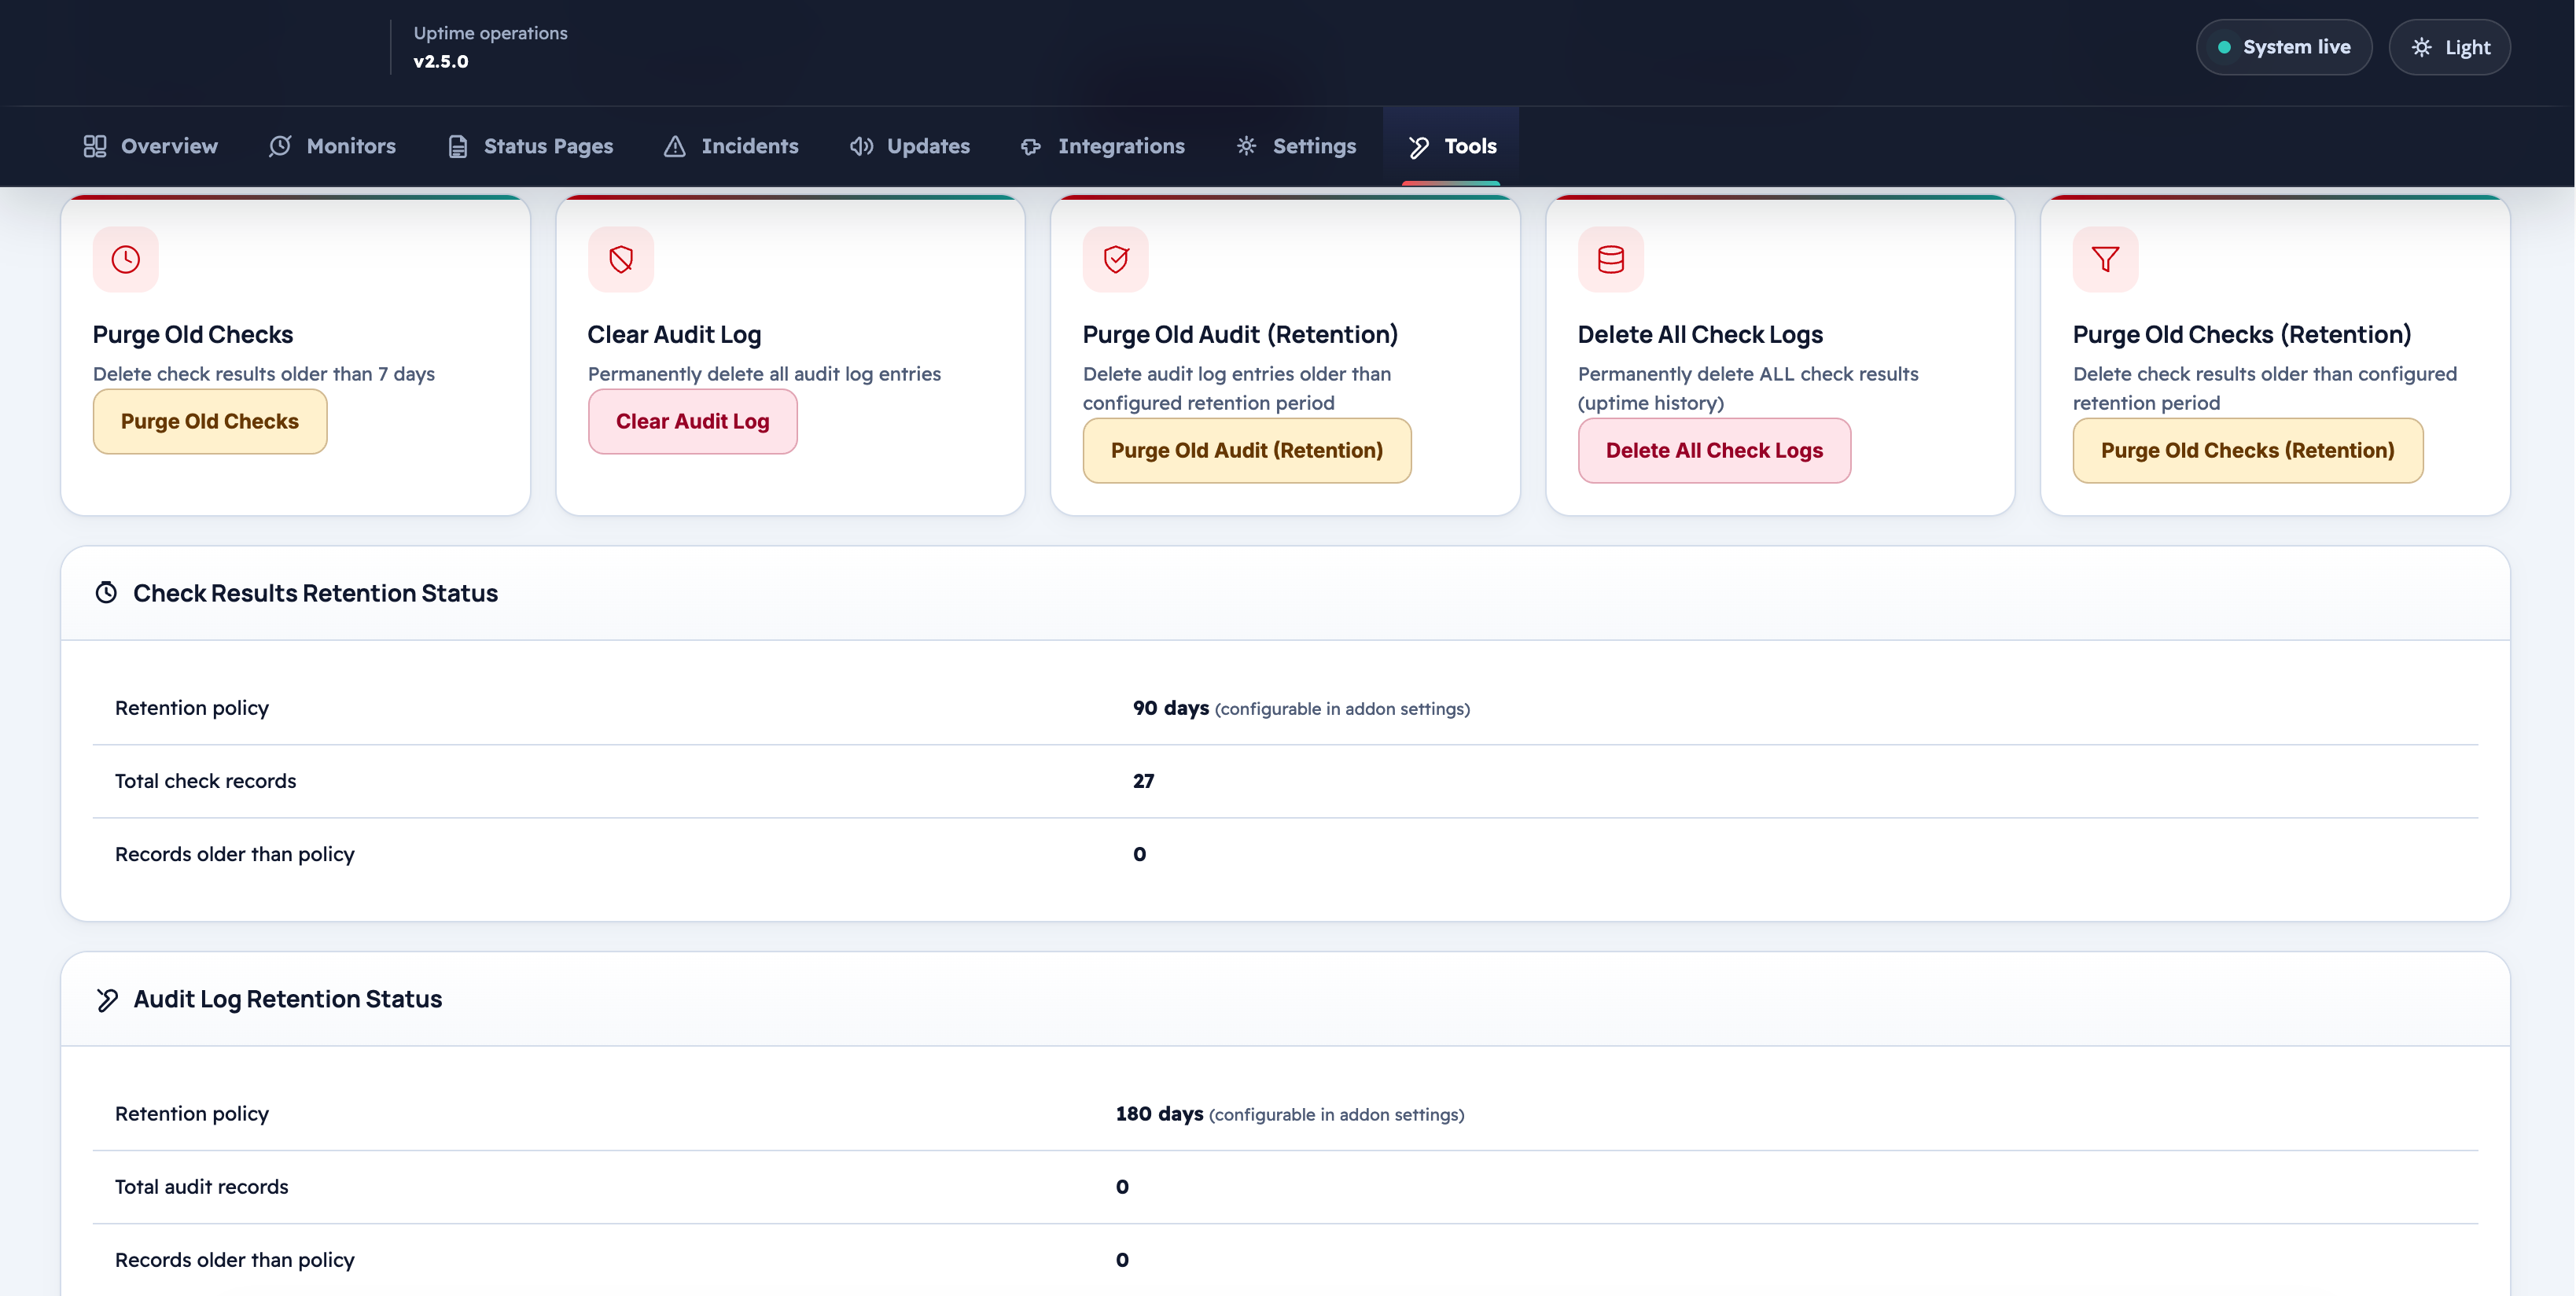
Uptime Monitor 2 stores check results and the audit log indefinitely unless retention limits are configured.
Automatic Retention
| Data | Setting | Default |
|---|---|---|
Check results (mod_um_checks) |
checks_retention_days |
180 days |
Audit log (mod_um_audit) |
audit_retention_days |
180 days |
The daily automatic cleanup runs via the cron job and removes records older than the configured retention period.
Manual Purge
| Action | What it removes |
|---|---|
| Purge Old Check Results | Deletes check results older than the configured retention period immediately |
| Purge Old Audit Logs | Deletes audit entries older than the configured retention period immediately |
| Purge All Check Results | Removes all check results — use with caution; clears historical data |
Caution
Purge All Check Results is irreversible. All response time history, uptime percentages, and SLA data will be lost.
Database Statistics
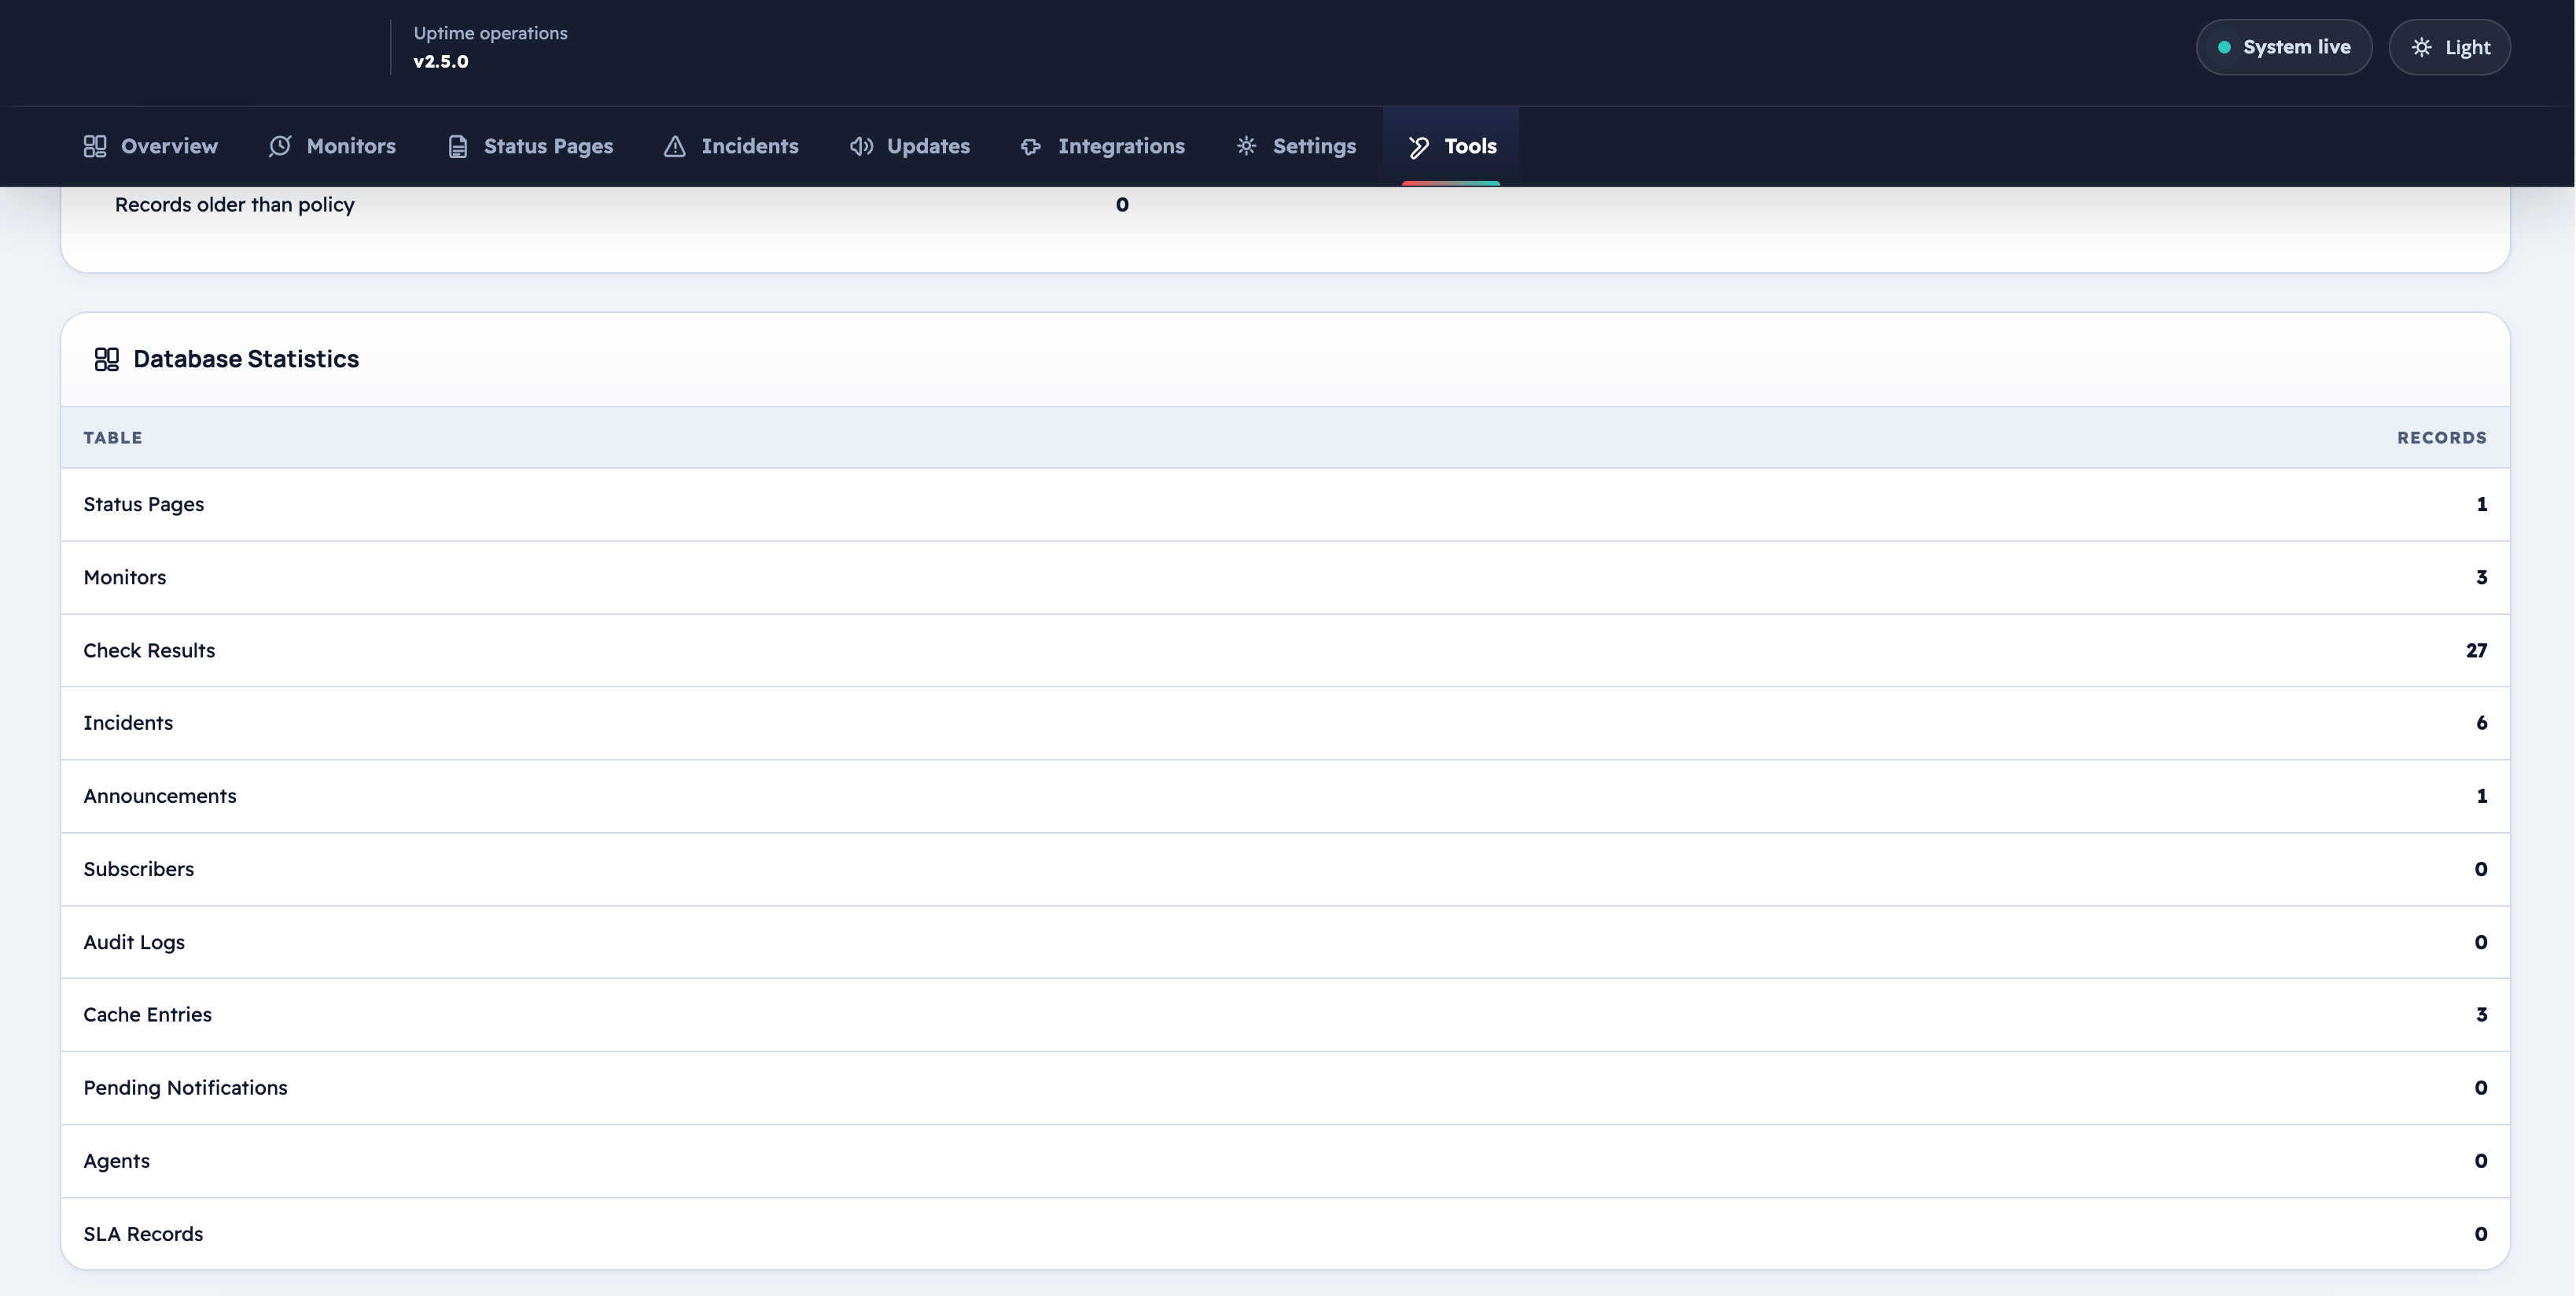
The diagnostics panel shows a summary of the current database usage:
| Table | What it tracks |
|---|---|
mod_um_monitors |
All configured monitors |
mod_um_checks |
Individual check result records |
mod_um_incidents |
Published incidents |
mod_um_audit |
Administrator activity entries |
mod_um_pages |
Status pages |
mod_um_subscribers |
Email subscribers |
mod_um_agents |
Distributed monitoring agents |
The panel displays row counts and table sizes to help identify when purging is advisable.
System Diagnostics
The diagnostics section verifies that the server environment meets Uptime Monitor 2's requirements:
| Check | Required |
|---|---|
| PHP version | 8.2+ |
curl extension |
Present and enabled |
json extension |
Present and enabled |
mbstring extension |
Present and enabled |
openssl extension |
Present and enabled |
| APCu extension | Optional (improves performance) |
| WHMCS version | 9.0+ |
| Cron last run | Within last 10 minutes |
| License status | Active |
| Database migrations | All applied |
A green check indicates the requirement is met. A red X indicates a problem that may affect functionality.
Troubleshooting
| Problem | Fix |
|---|---|
| Force Run returns no results | Confirm at least one monitor is enabled |
| Purge button does nothing | Check database permissions for DELETE |
| High check result count | Lower checks_retention_days and run a manual purge |
| APCu shows as missing | Install the APCu PHP extension for your PHP version |
| Cron last run is stale | Verify the WHMCS cron command is configured and running |