
Settings
General settings
This page lists the remaining settings tabs. It is for the WHMCS administrator. System names are the stored setting keys.
General
Settings → General
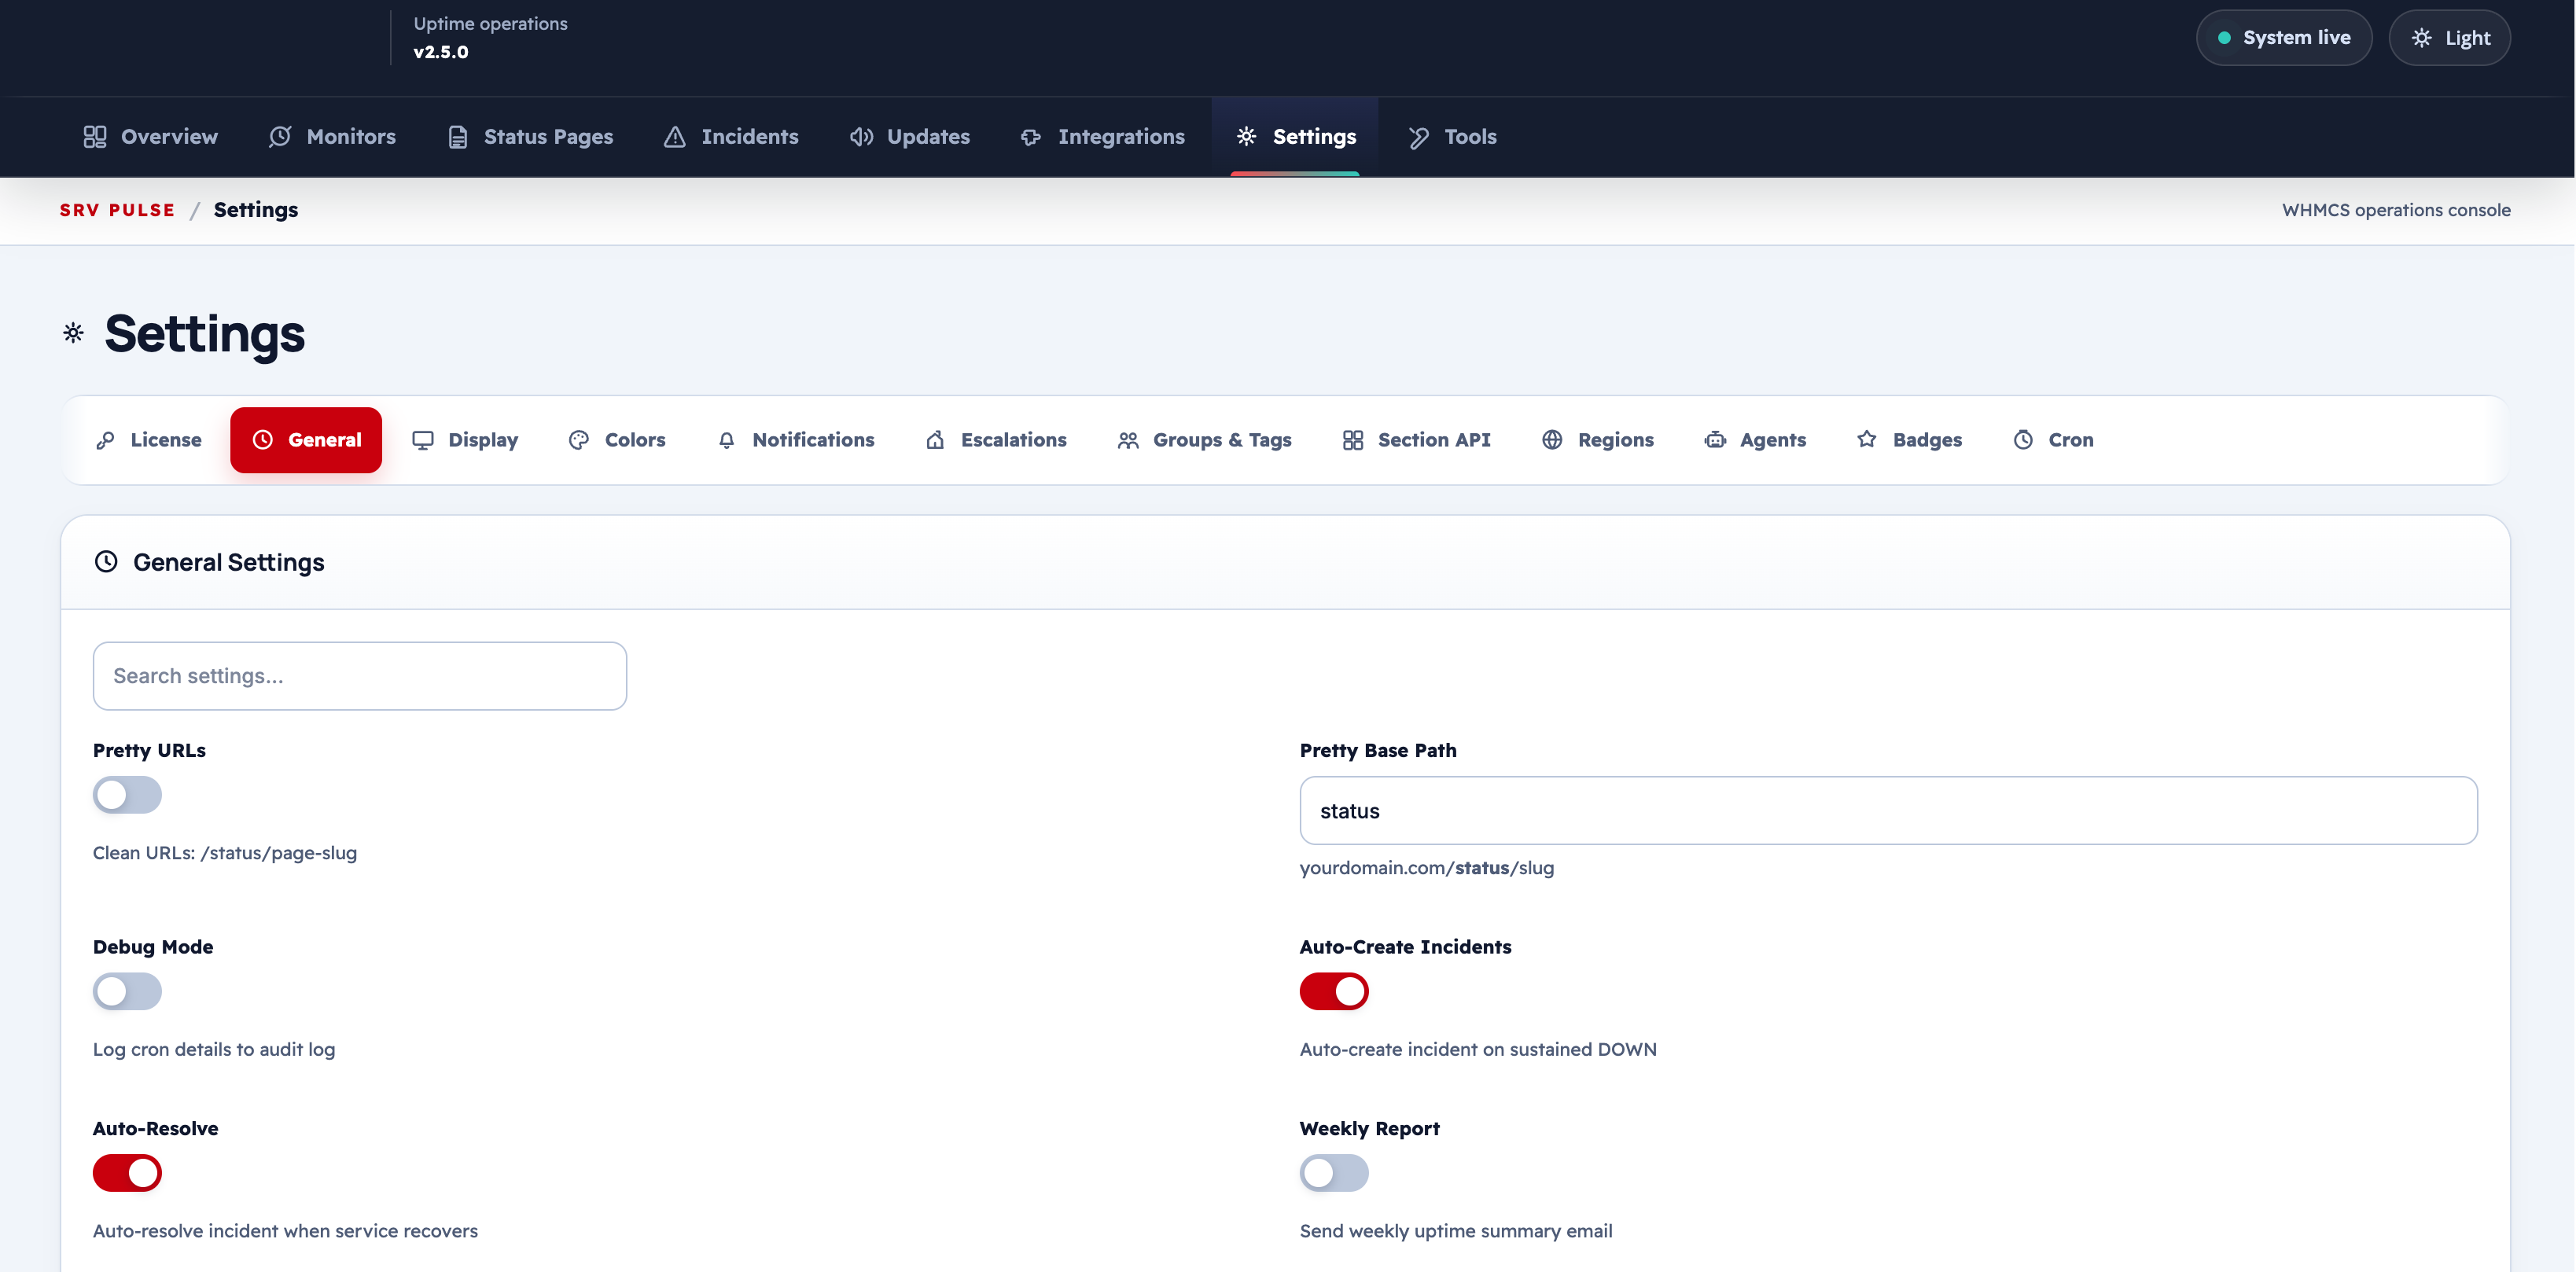
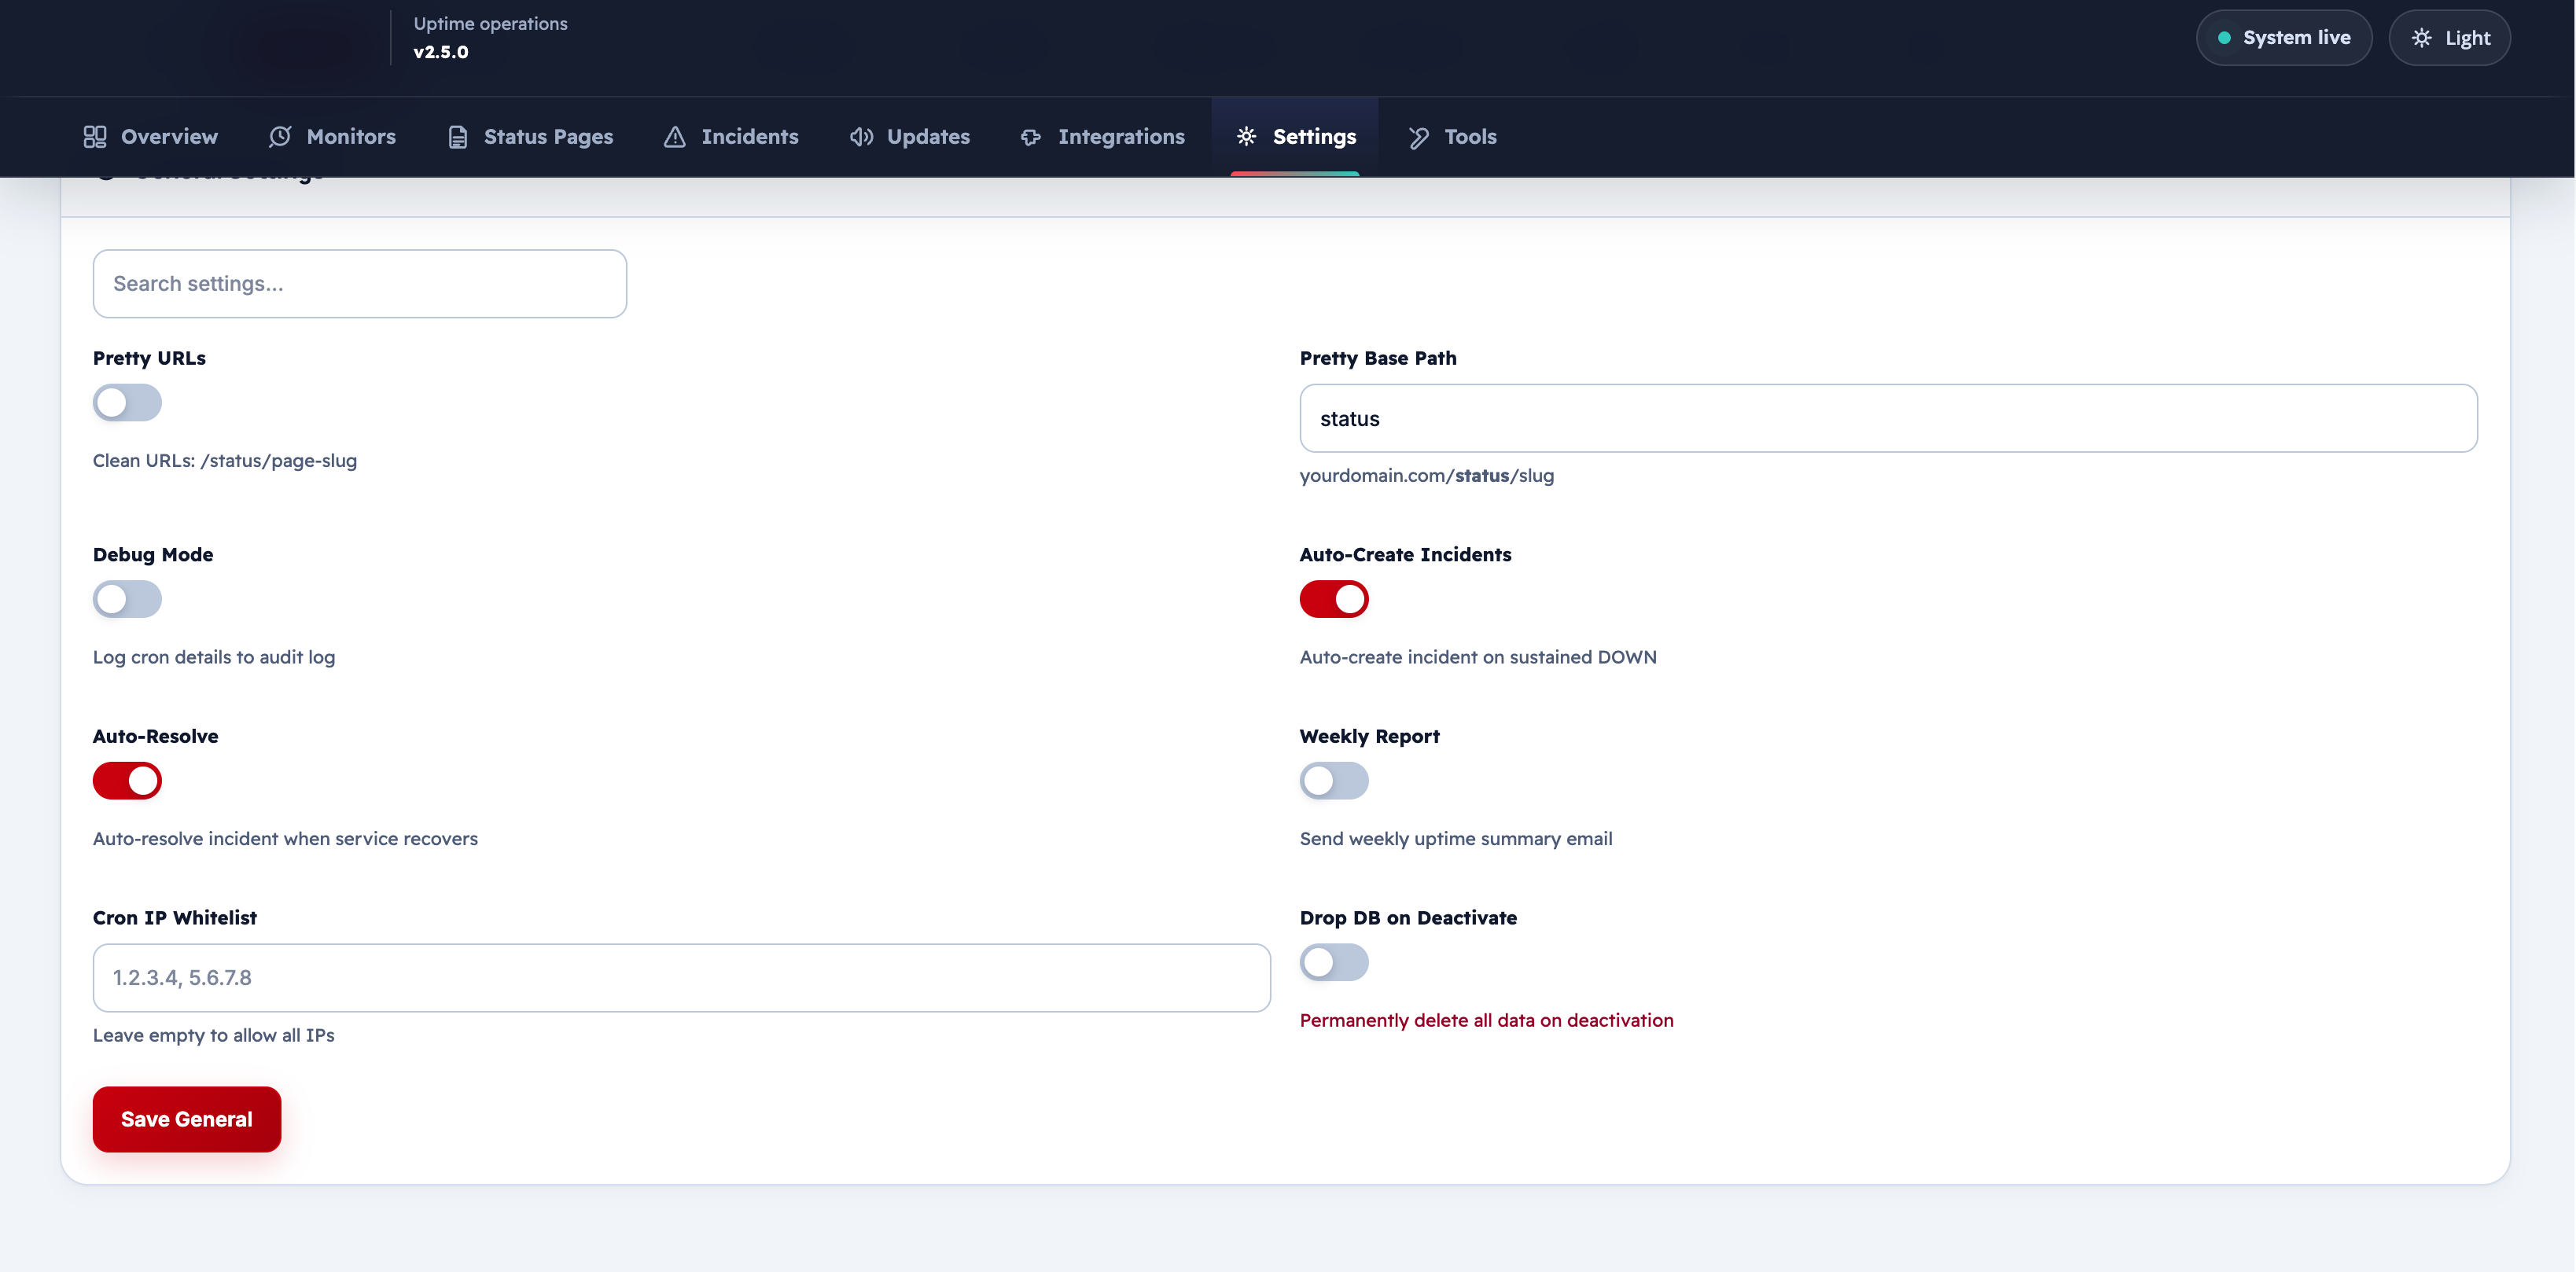
| Friendly name | System name | Type | Default |
|---|---|---|---|
| Site name | site_name |
text | — |
| Pretty URLs | pretty_urls |
yes/no | No |
| Pretty base path | pretty_base |
text | status |
| Debug mode | debug_mode |
yes/no | No |
| Auto-create incidents | auto_incident |
yes/no | No |
| Auto-resolve incidents | auto_resolve |
yes/no | No |
| Weekly report | weekly_report |
yes/no | No |
| Cron IP whitelist | cron_ip_whitelist |
text | — |
| Drop database on deactivate | drop_on_deactivate |
yes/no | No |
| Check history retention (days) | checks_retention_days |
number | 180 |
| Audit log retention (days) | audit_retention_days |
number | 180 |
| Timezone | timezone |
text | Server default |
pretty_urls turns the client-area path into /status/{slug} using pretty_base. debug_mode writes cron detail into the audit log and can show PHP errors to visitors, so leave it off on a live site. auto_incident opens an incident only after a monitor stays Down. auto_resolve closes that incident when the monitor returns Up. cron_ip_whitelist is a comma-separated list. An empty list does not restrict the cron URL. drop_on_deactivate deletes addon data when the module is deactivated.
Warning
Enable Debug Mode only on development environments. It can expose internal error details to visitors.
Display & Layout Settings
Settings → Display
This tab provides full control over the appearance and behavior of the public status page.
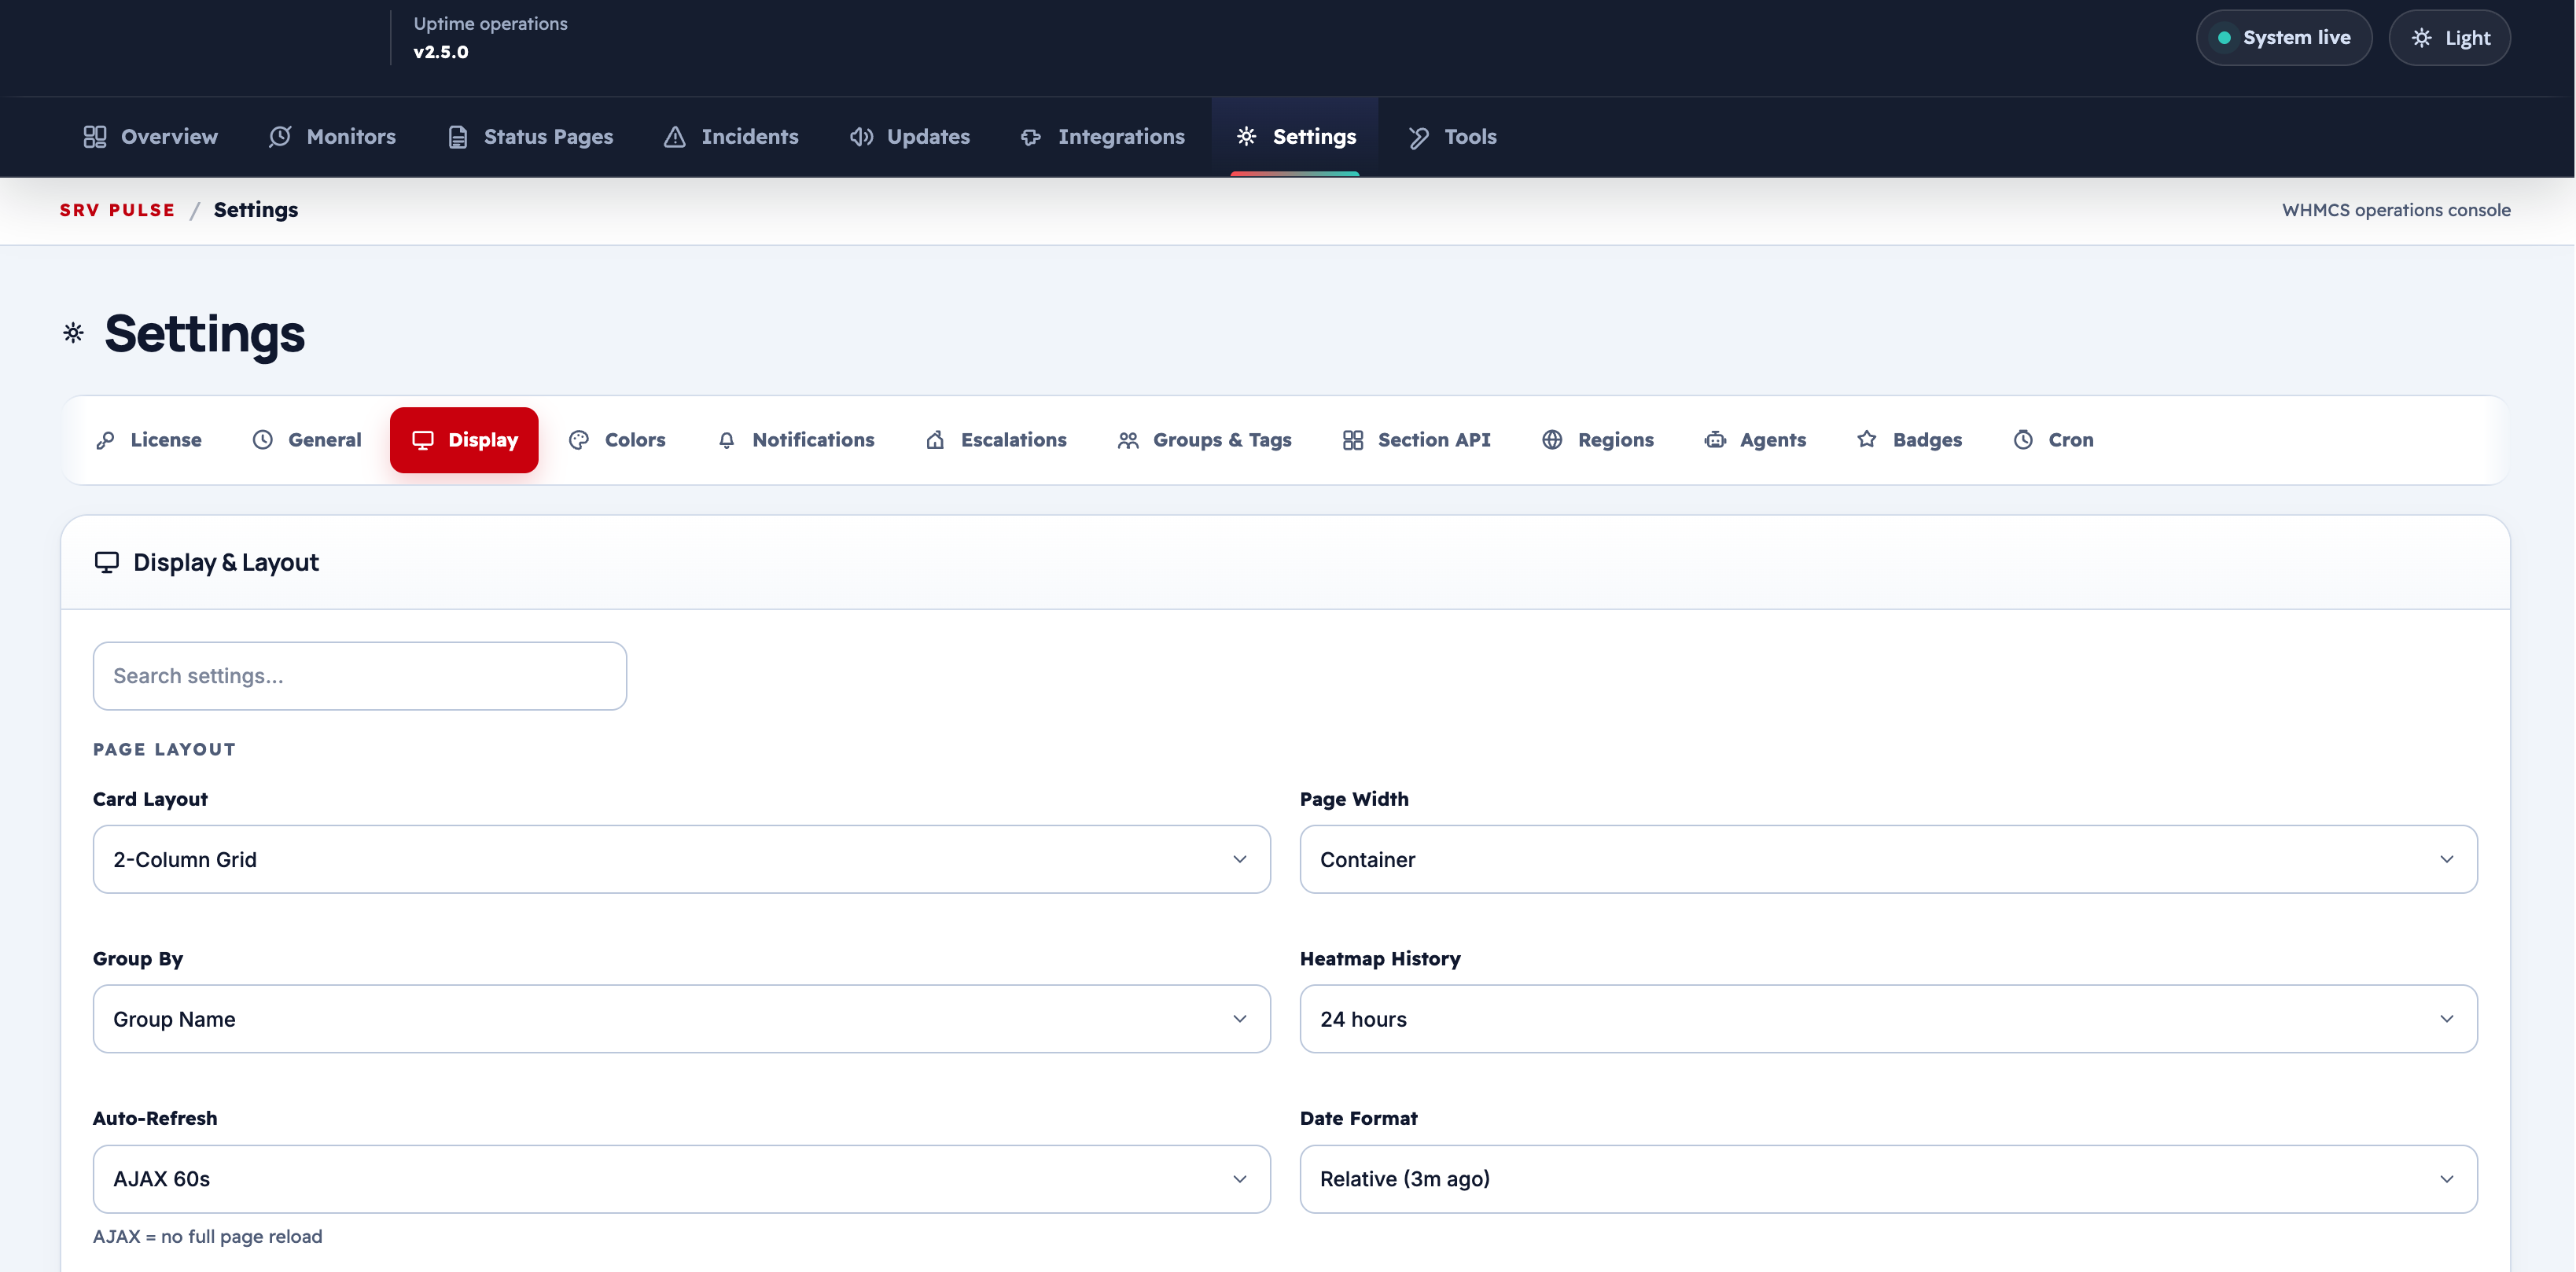
Page Layout
| Setting | Description | Options |
|---|---|---|
| Card Layout | Layout style for the status page | 2-Column Grid / 3-Column Grid / Full-width List |
| Page Width | Control the width of the page content | Container / Narrow / Full Width |
| Group By | How to group monitors on the page | Group Name / Monitor Type / No Grouping |
| Heatmap History | Time span shown on the heatmap | 24 hours / 7 days / 30 days / 90 days |
| Auto-Refresh | Automatically refresh page data via AJAX | Disabled / AJAX 30s / AJAX 60s / AJAX 2min |
| Date Format | How date and time are displayed | Relative (3m ago) / Absolute / Both |
| Incident Style | How incidents are listed | Timeline / Simple List / Accordion |
| Show Incidents | Number of recent incidents shown | 5 / 10 / 20 / All |
Card Content
This section allows you to toggle specific elements on monitor cards via checkboxes:
- Heatmap
- Uptime %
- Response time
- Last checked
- Monitor type
- Response chart
- Region results
- SLA badge
- Maintenance badge
- Subscribe bar
Card Rows per Layout
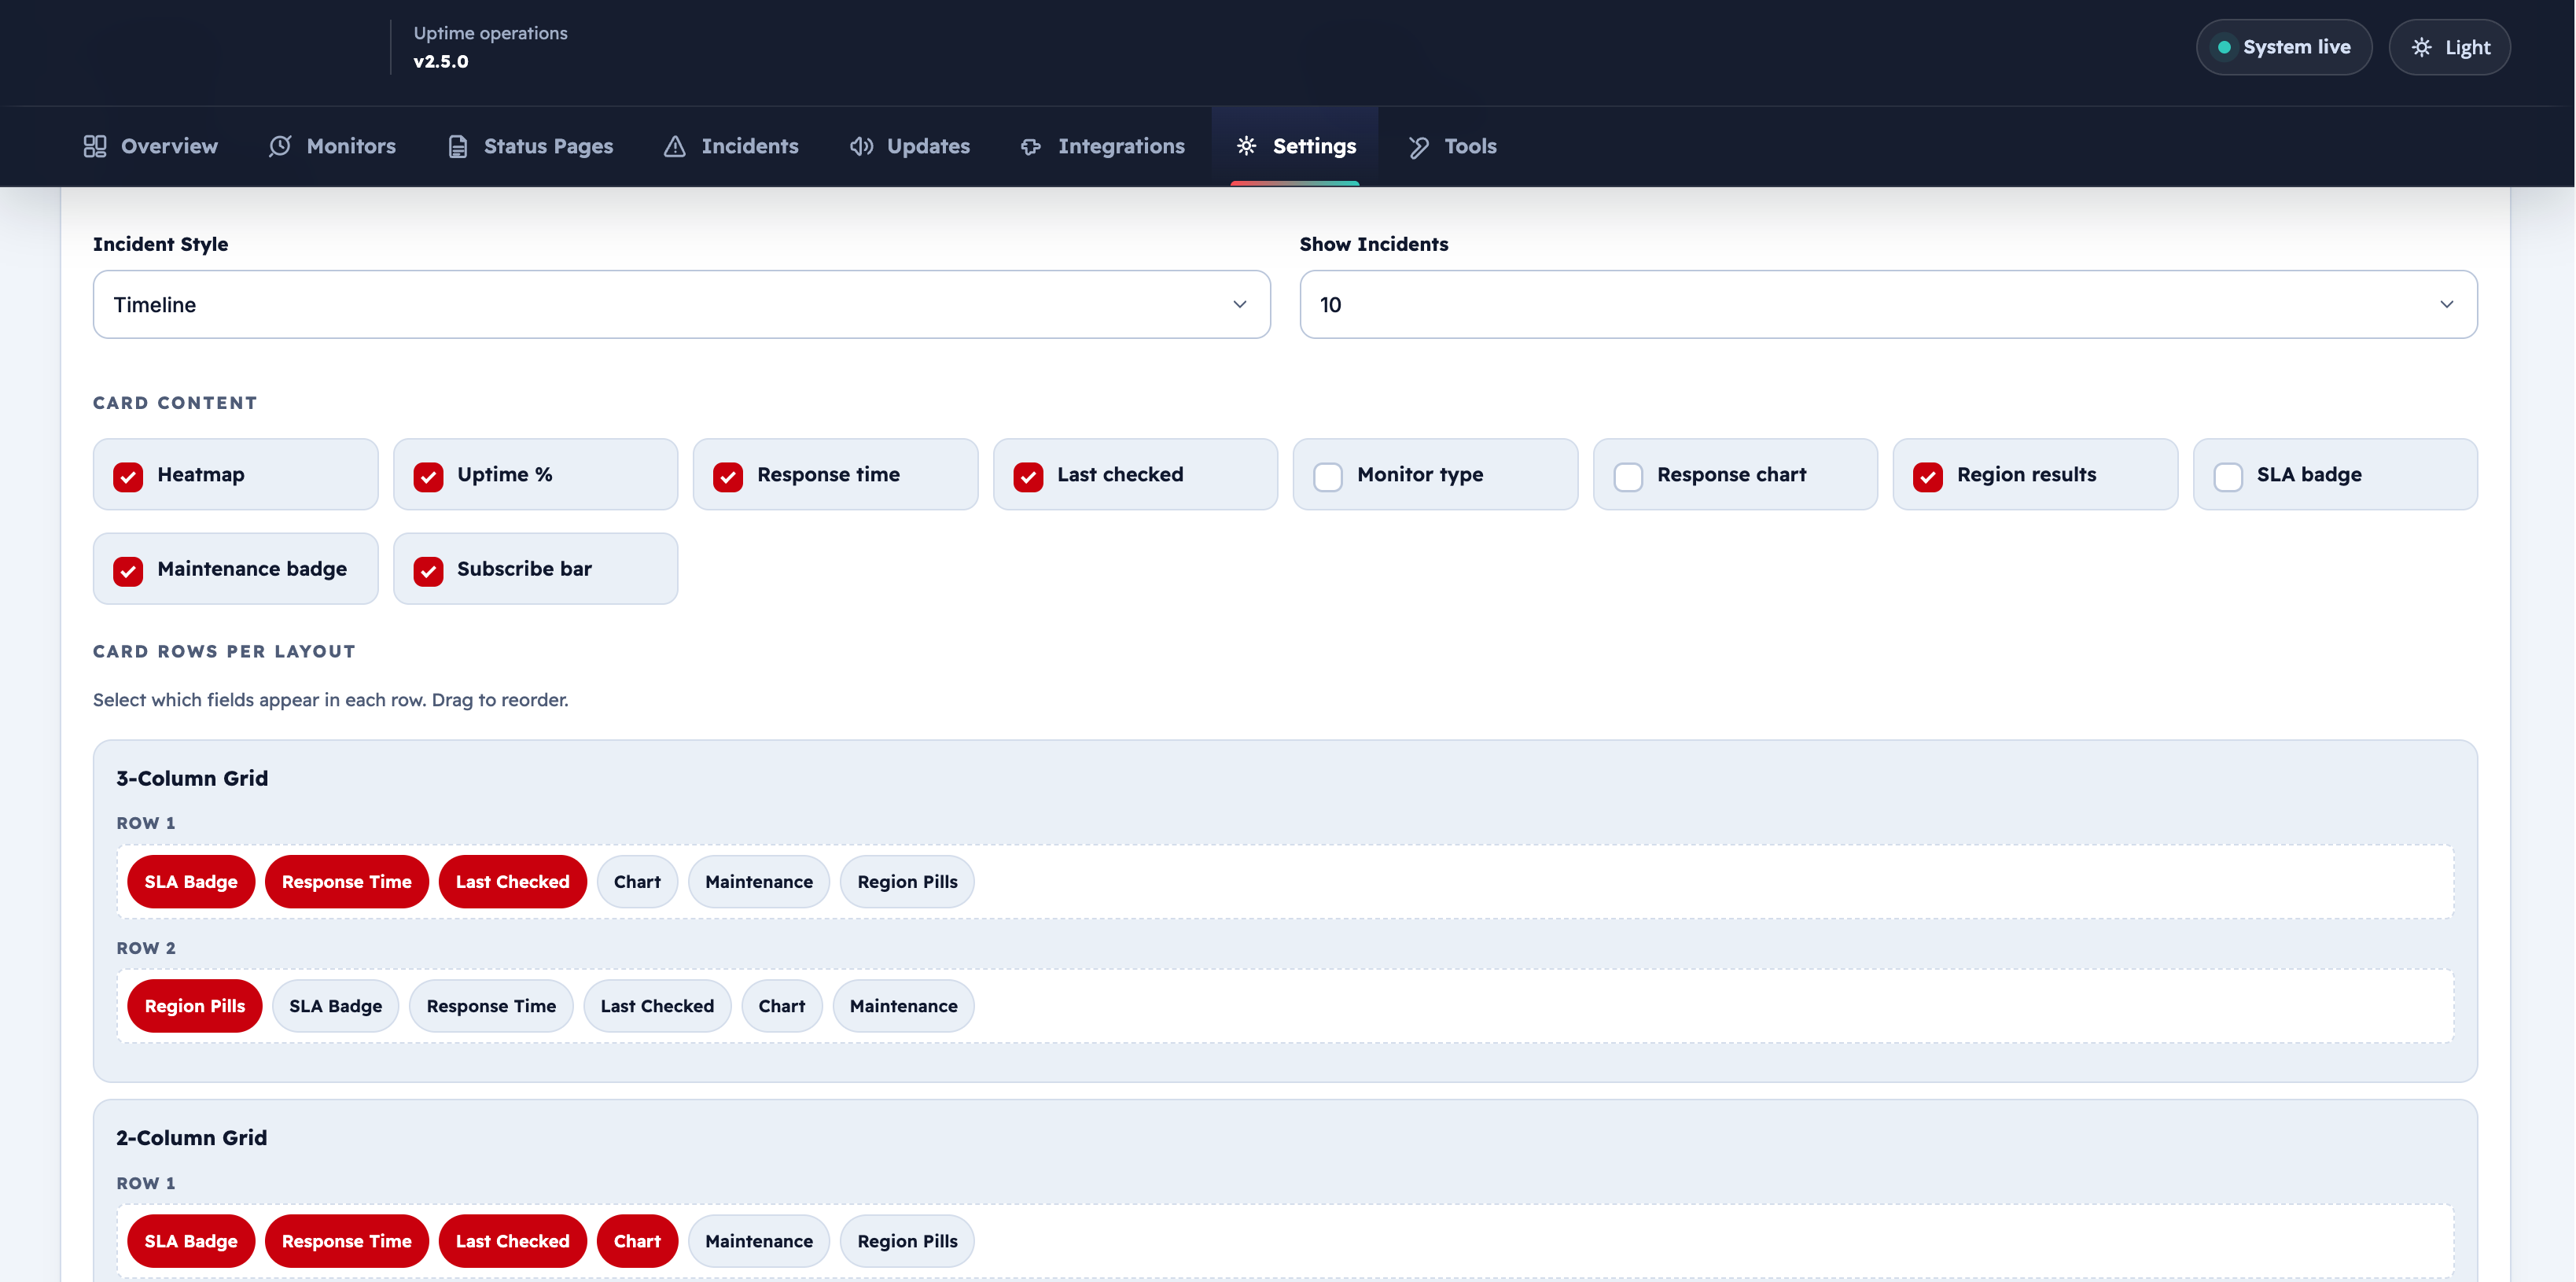 An advanced Drag and Drop builder that lets you customize which data fields appear in Row 1 and Row 2 of the monitor cards, independently for each layout (3-Column Grid, 2-Column Grid, List).
Incident Configuration
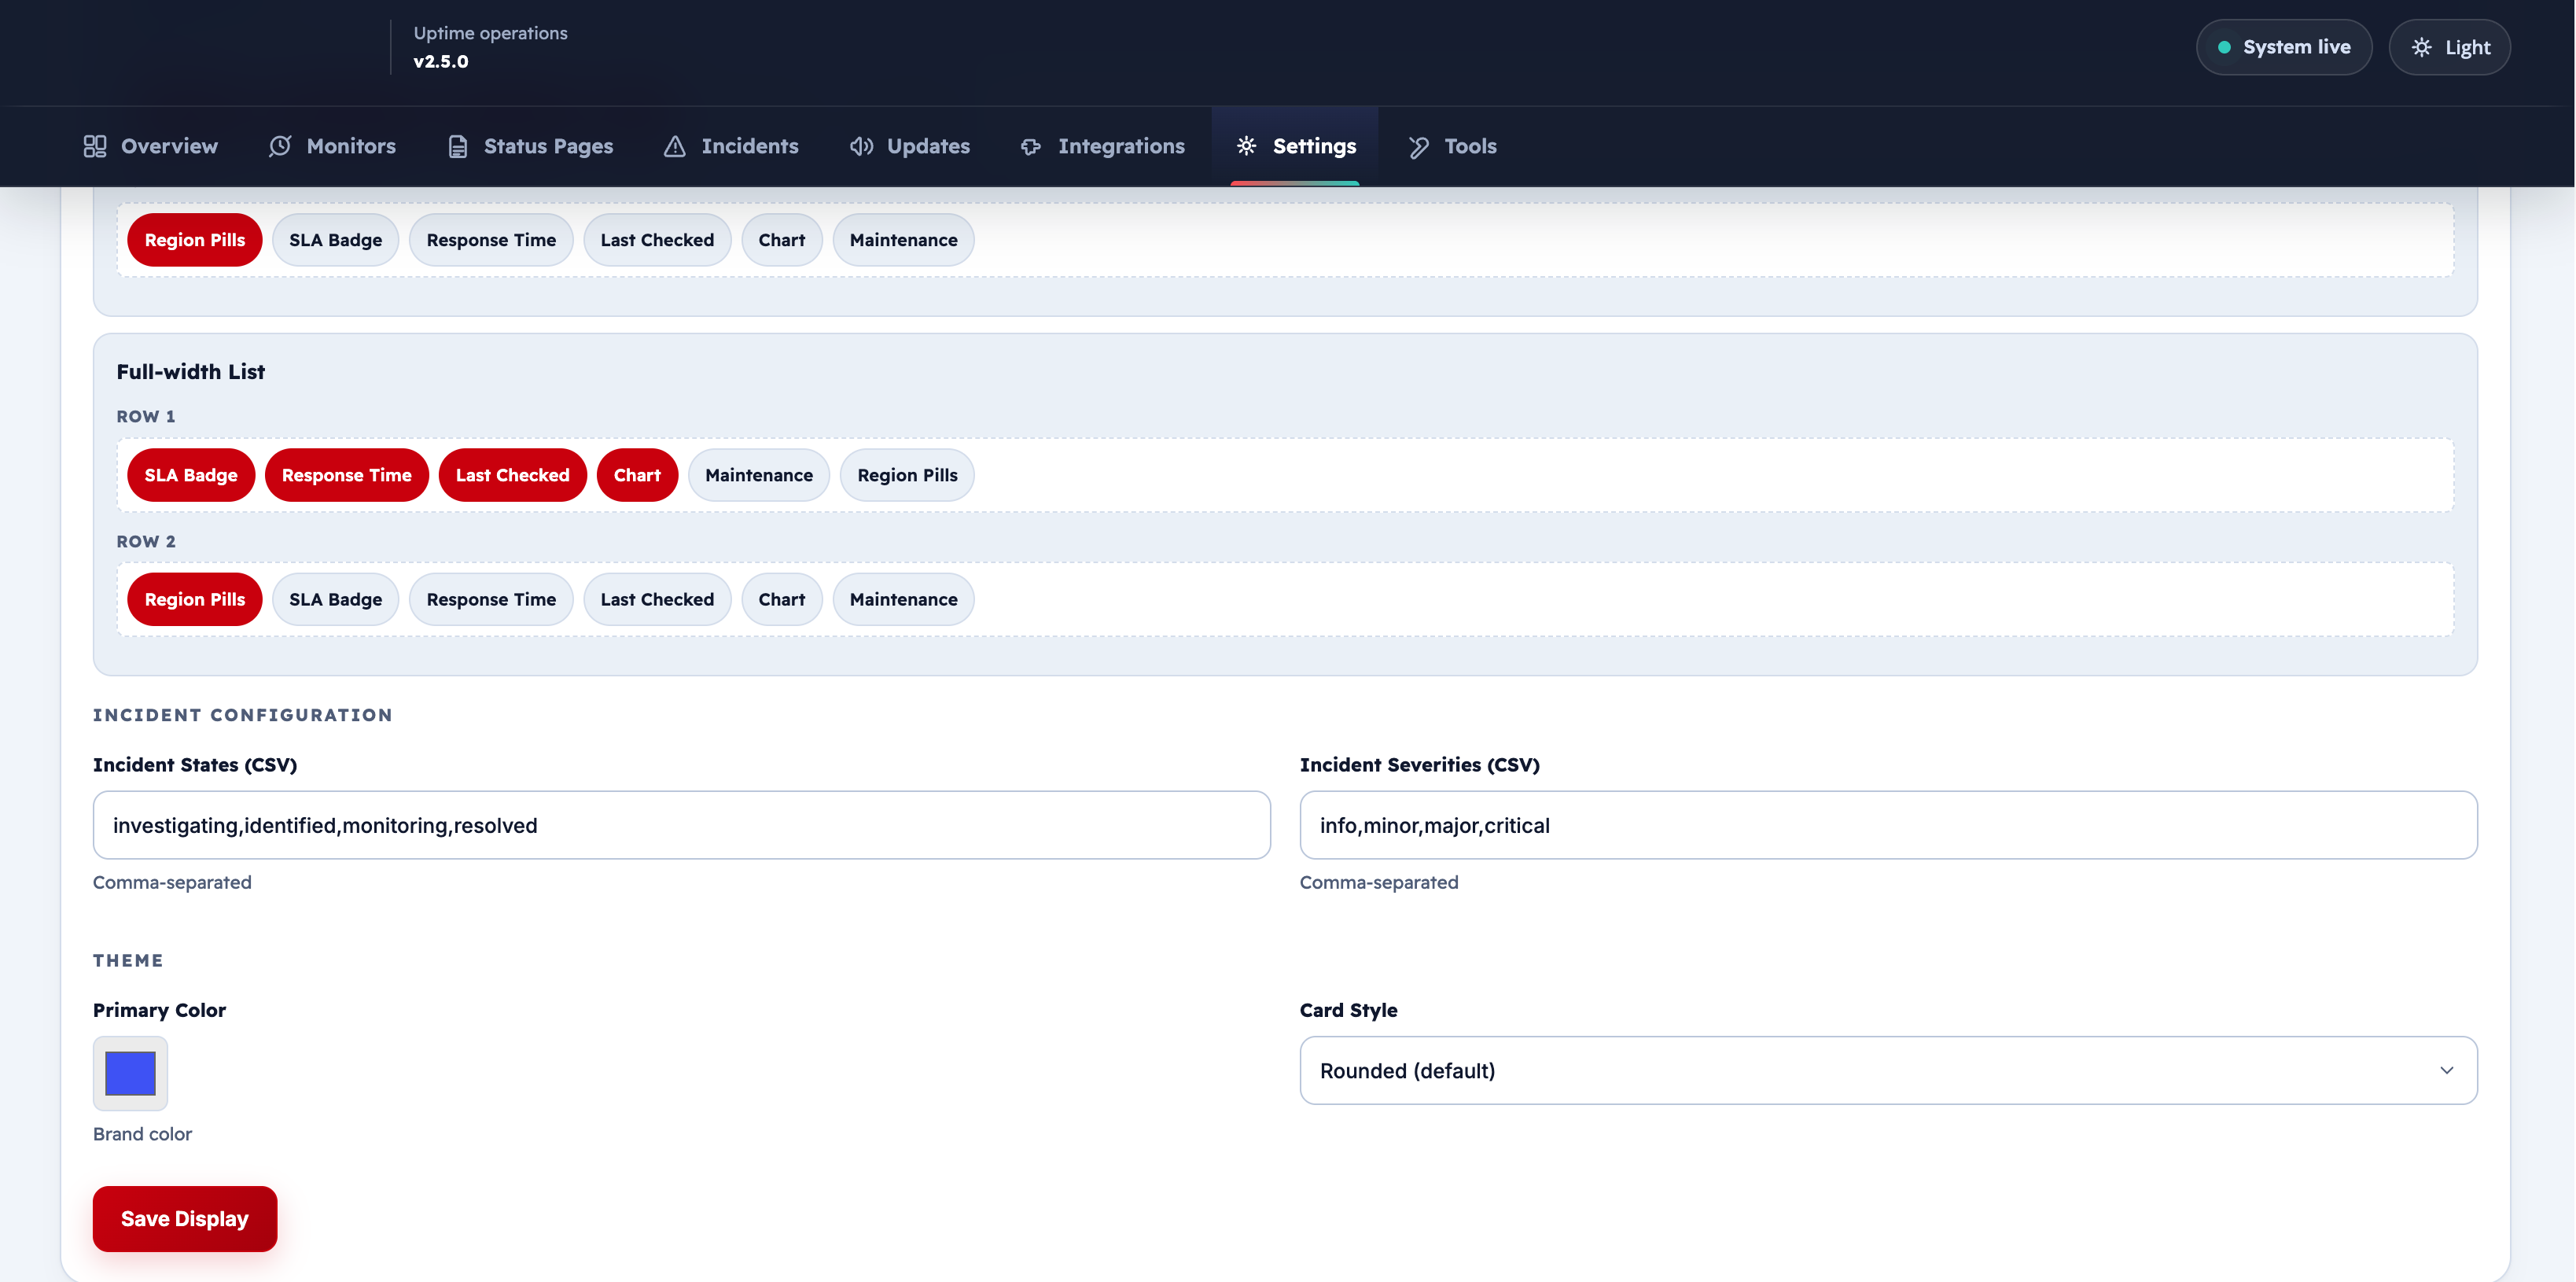 Full customization of incident states and severity levels:
- Incident States (CSV): Comma-separated list (Default: investigating, identified, monitoring, resolved).
- Incident Severities (CSV): Comma-separated list (Default: info, minor, major, critical).
Theme
- Primary Color: A color picker to set the brand color of the status page.
- Card Style: Control card border radius (Sharp, Rounded, or Pill).
Colors Settings
Settings → Colors
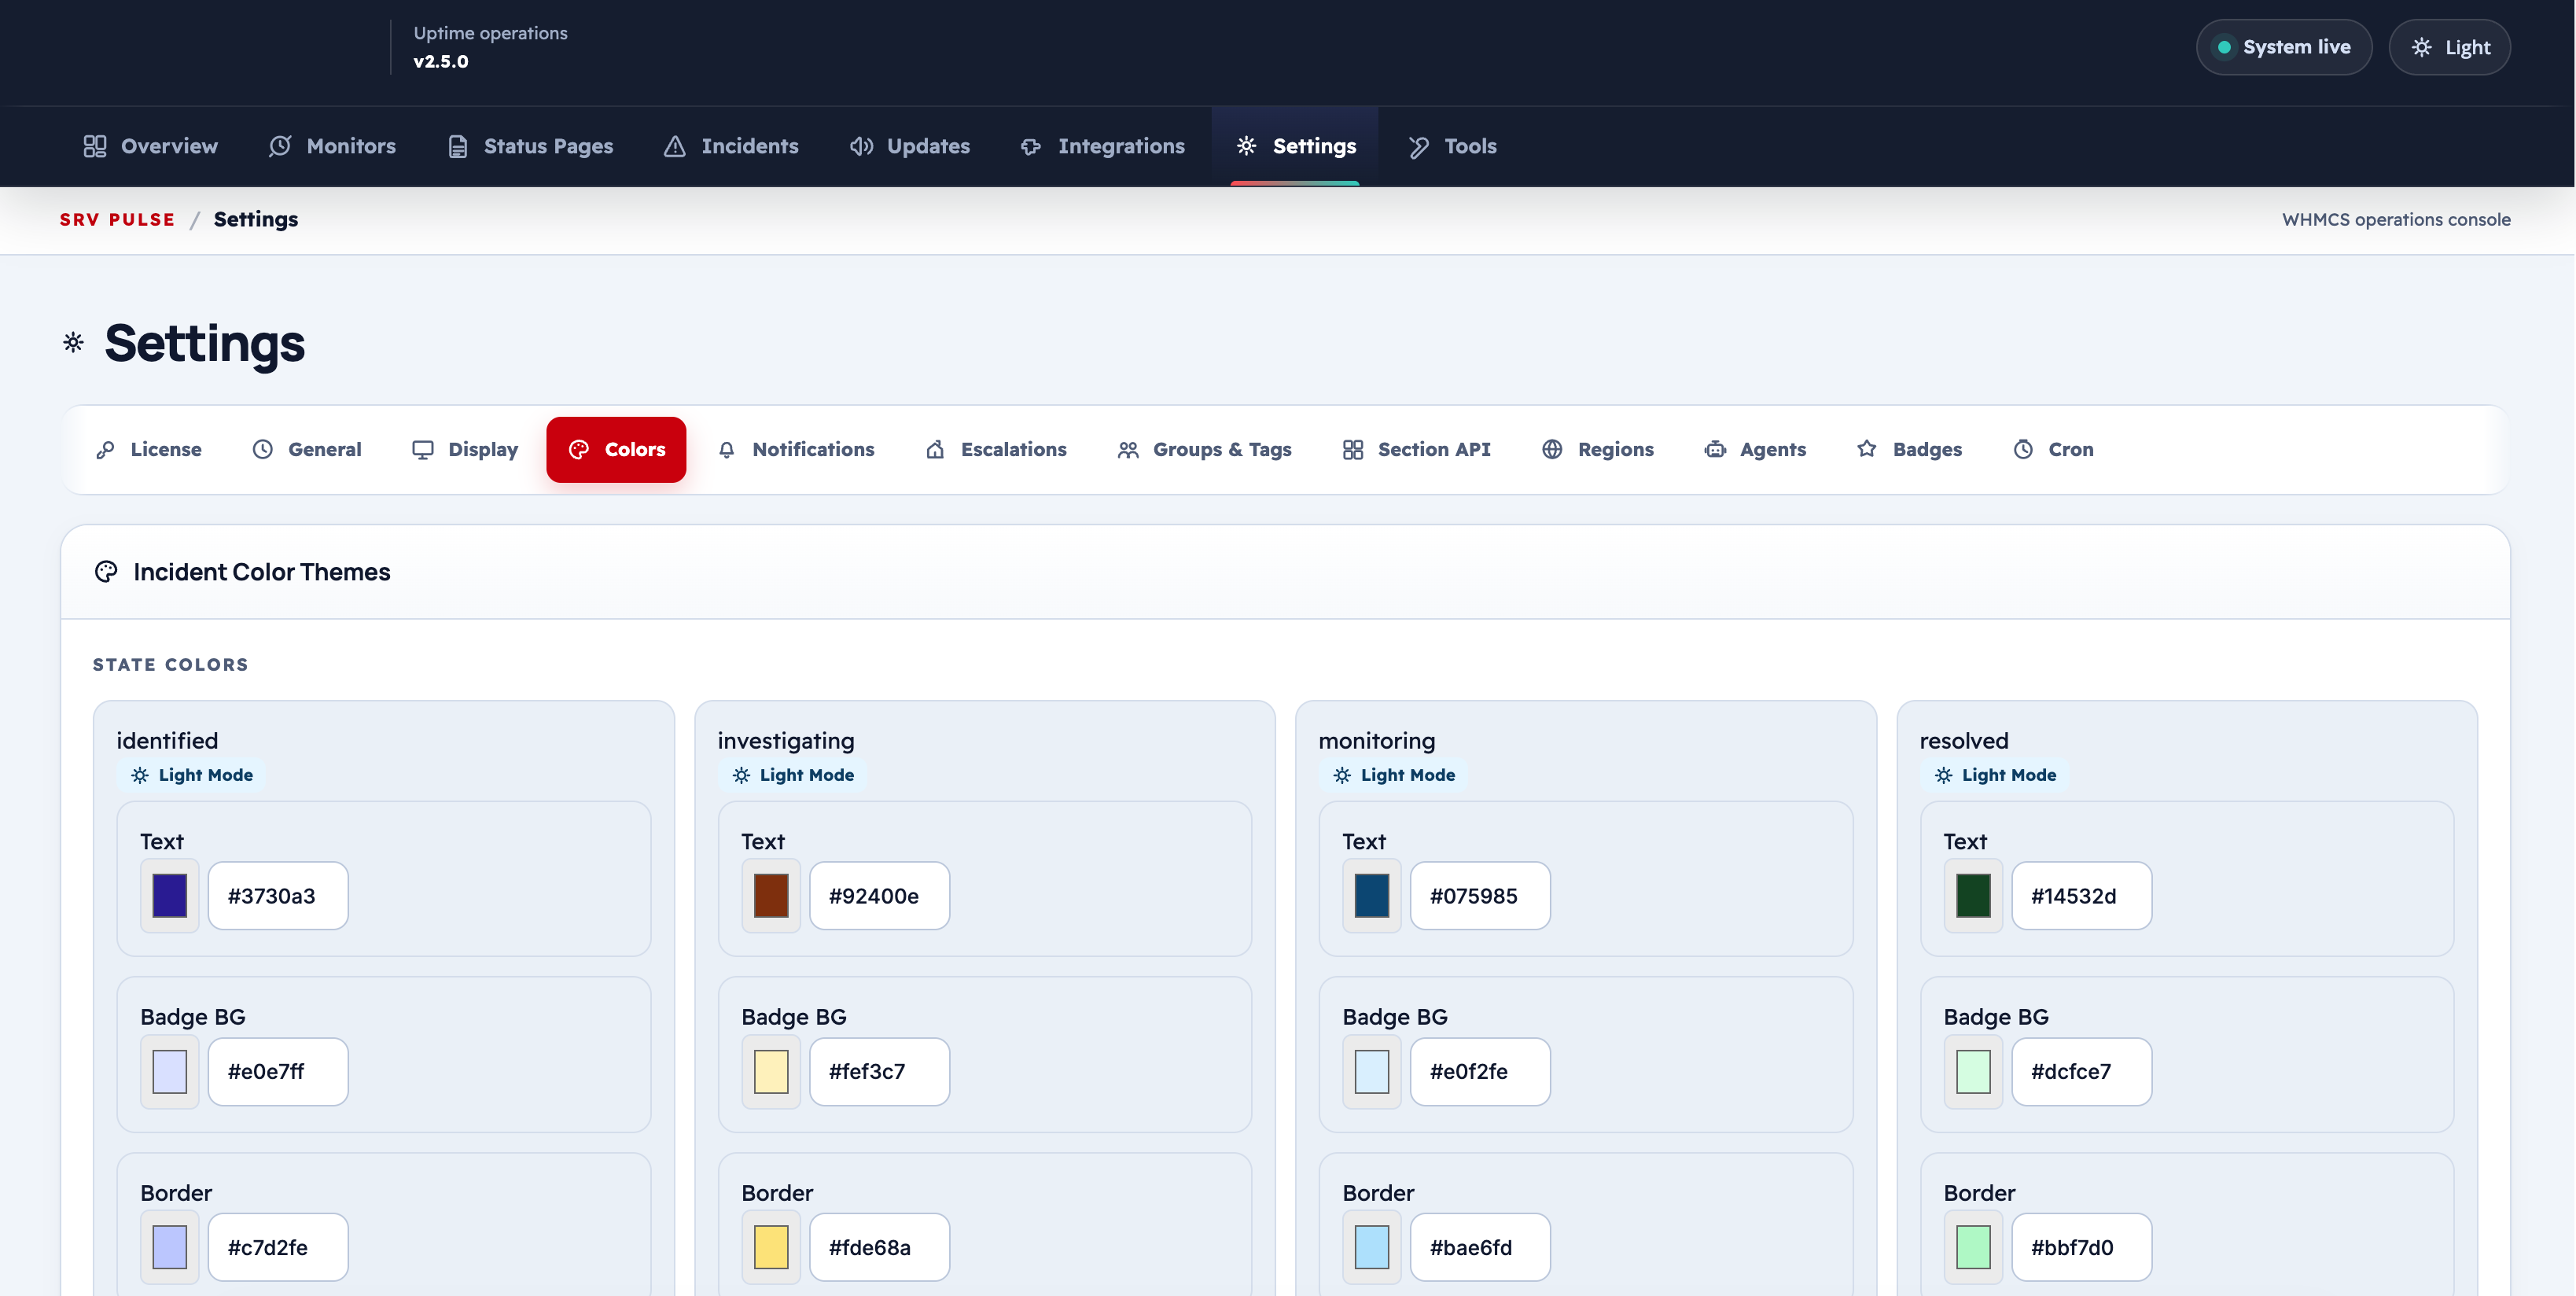
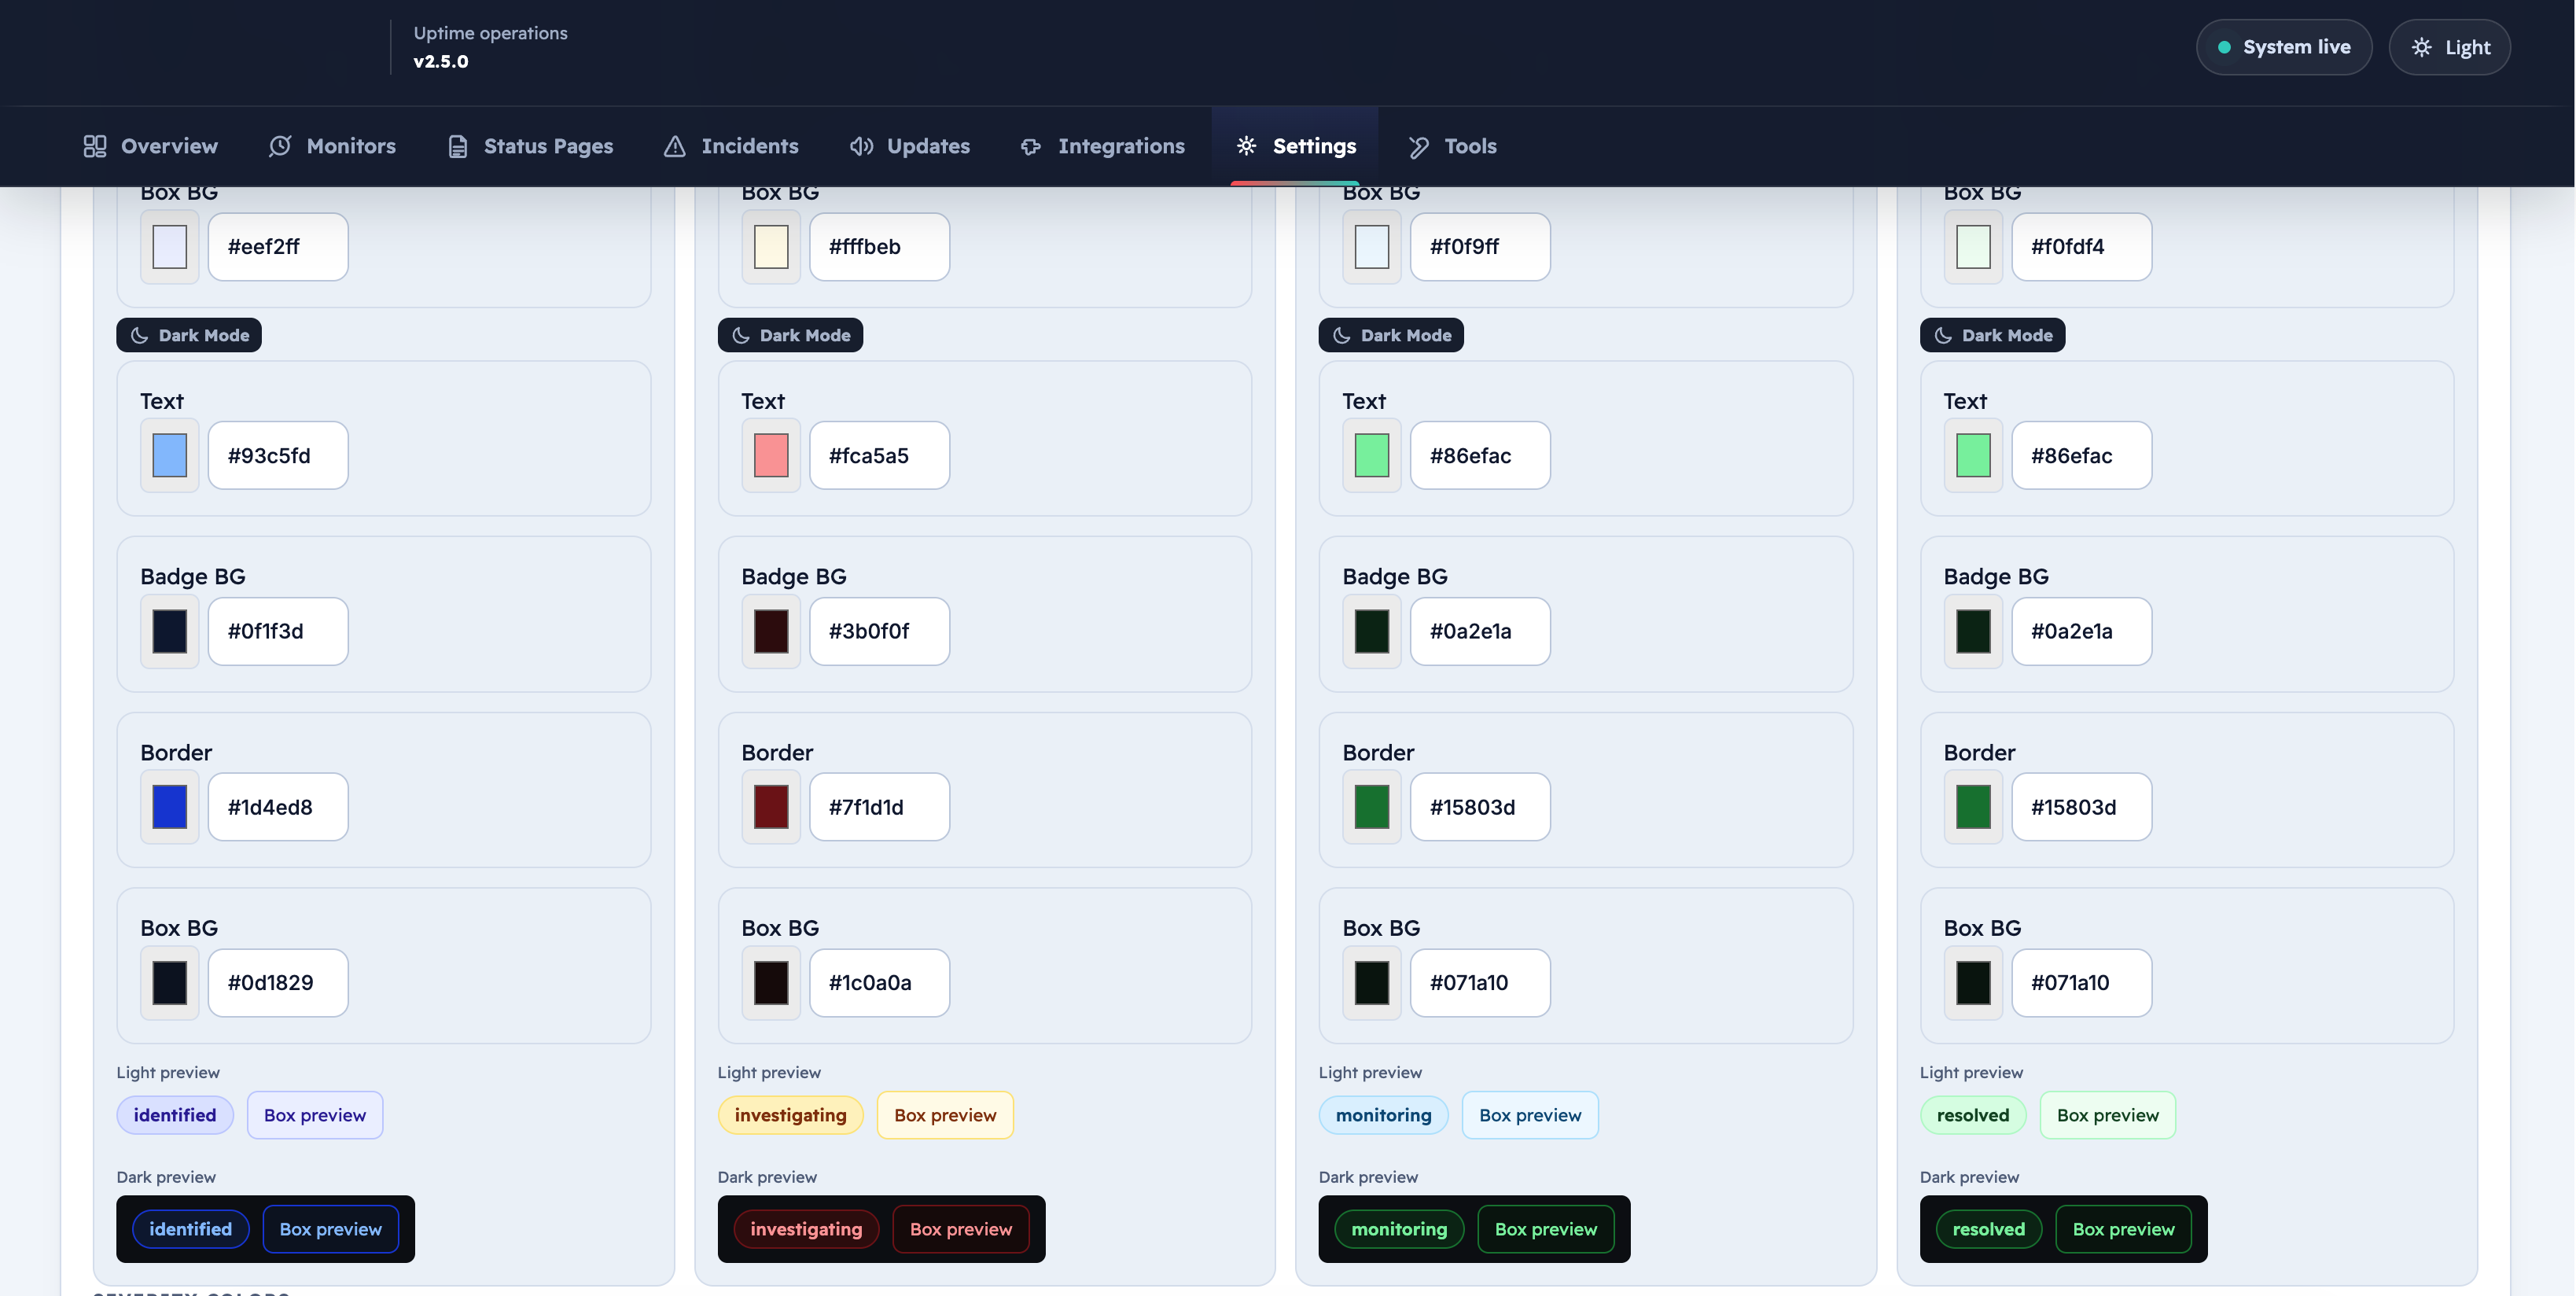
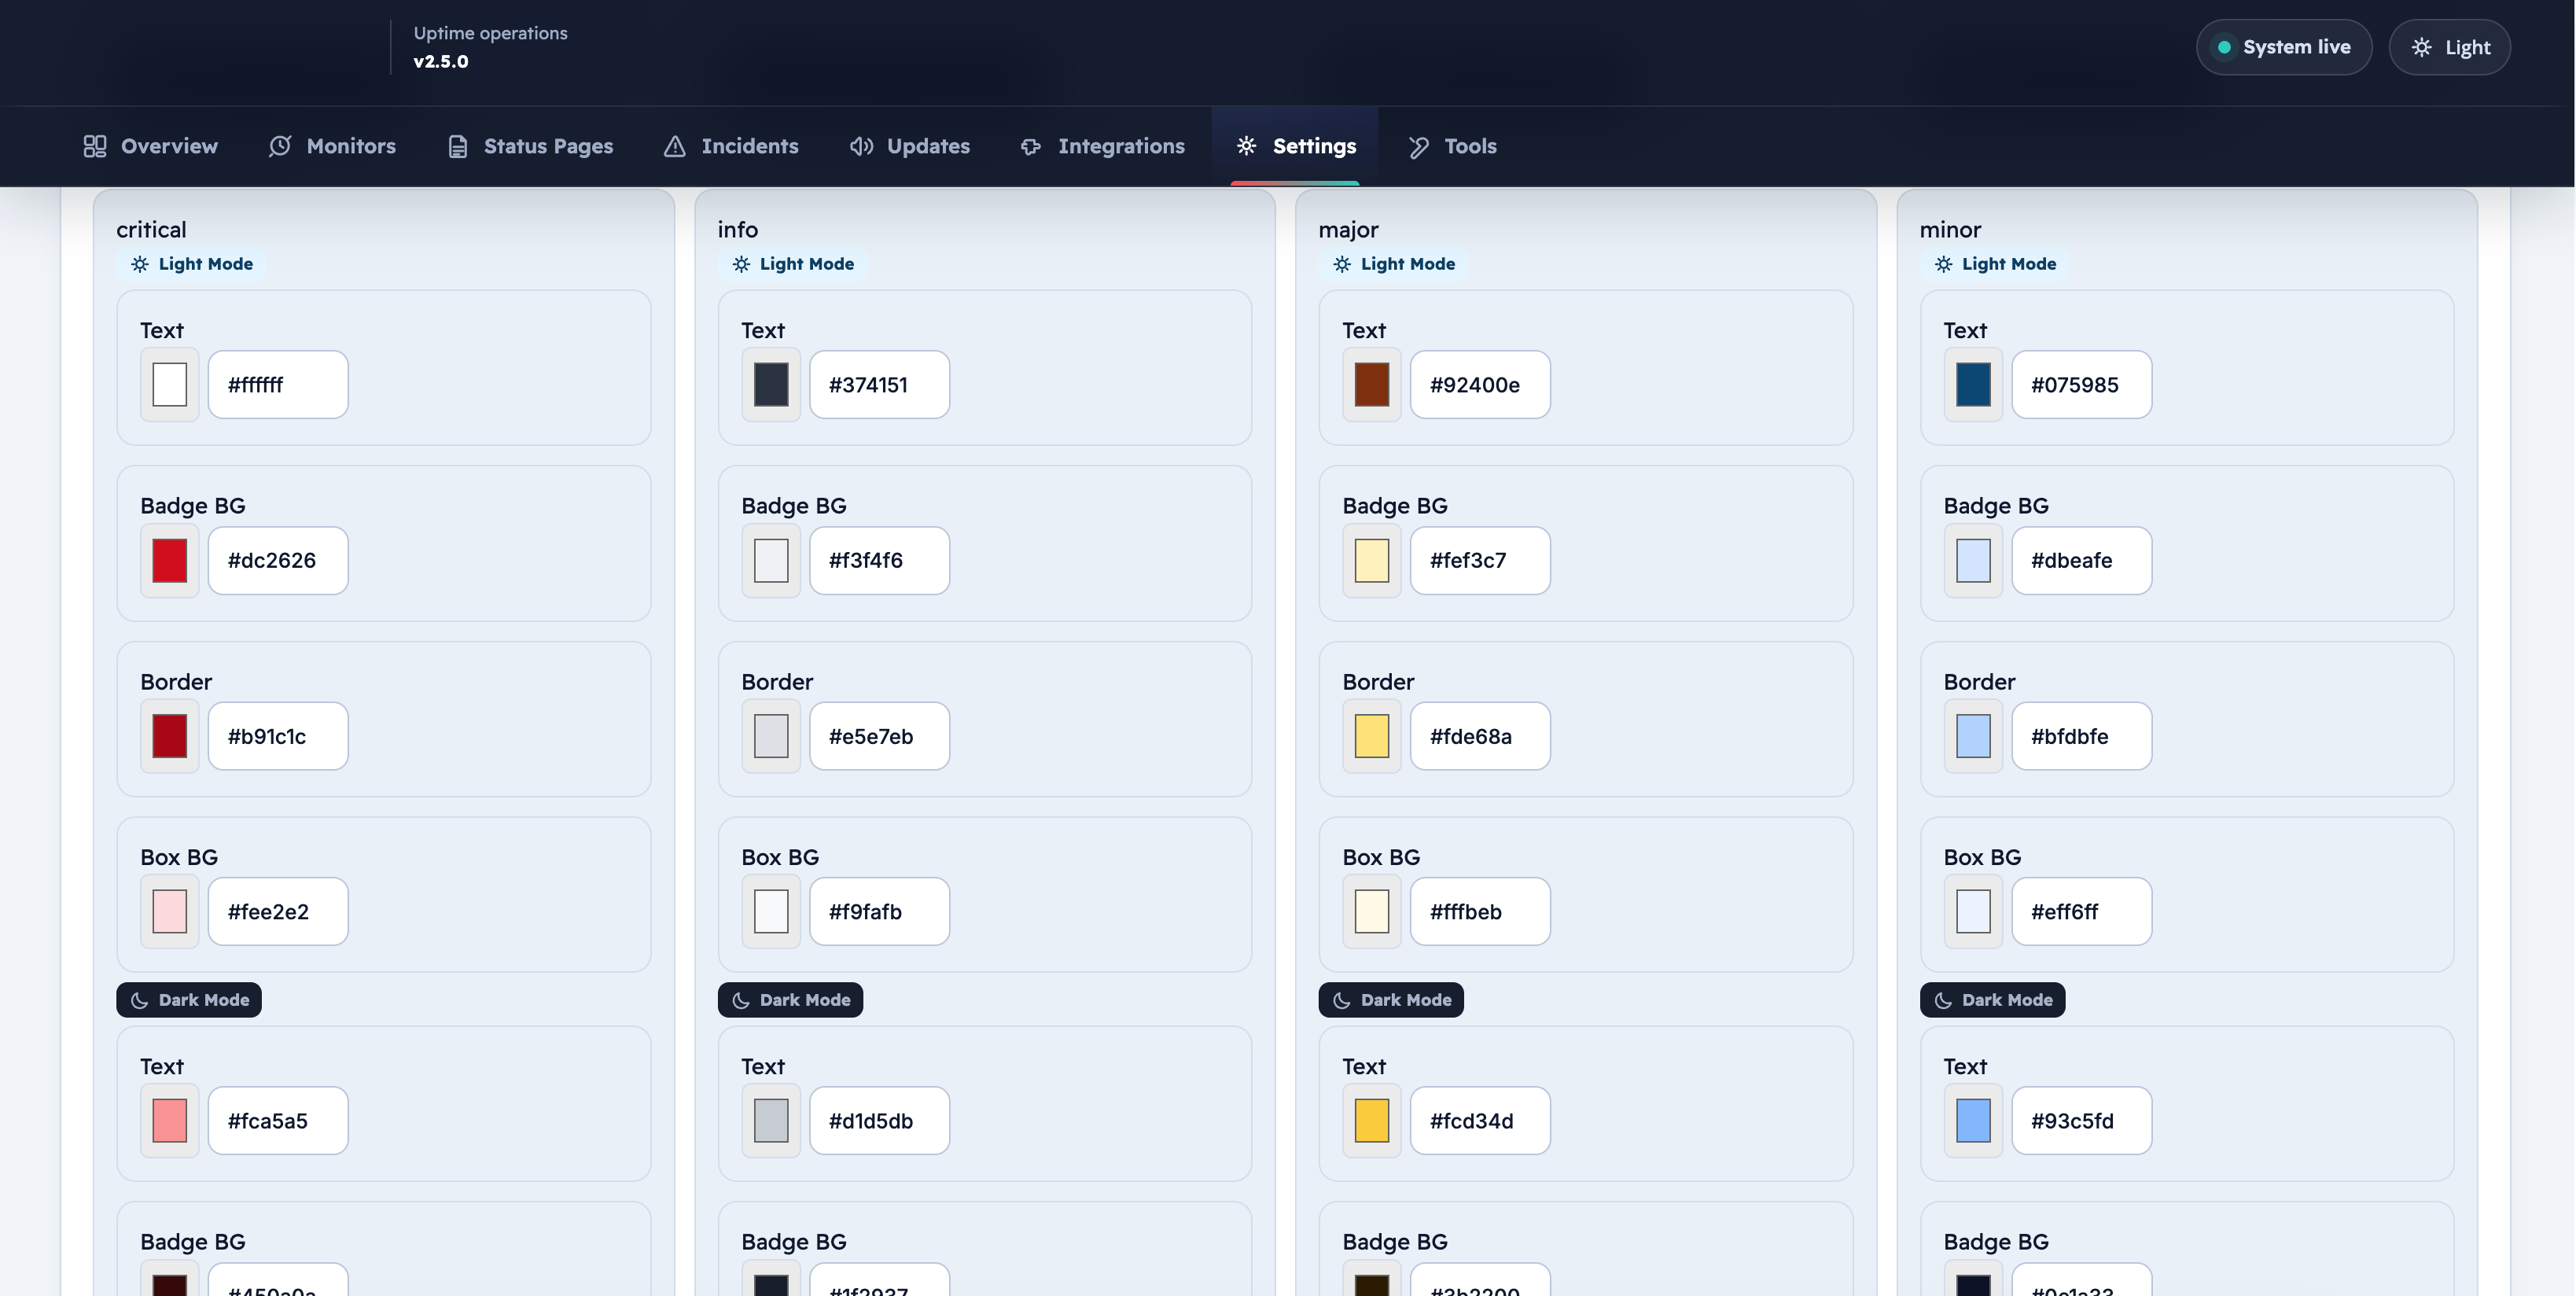
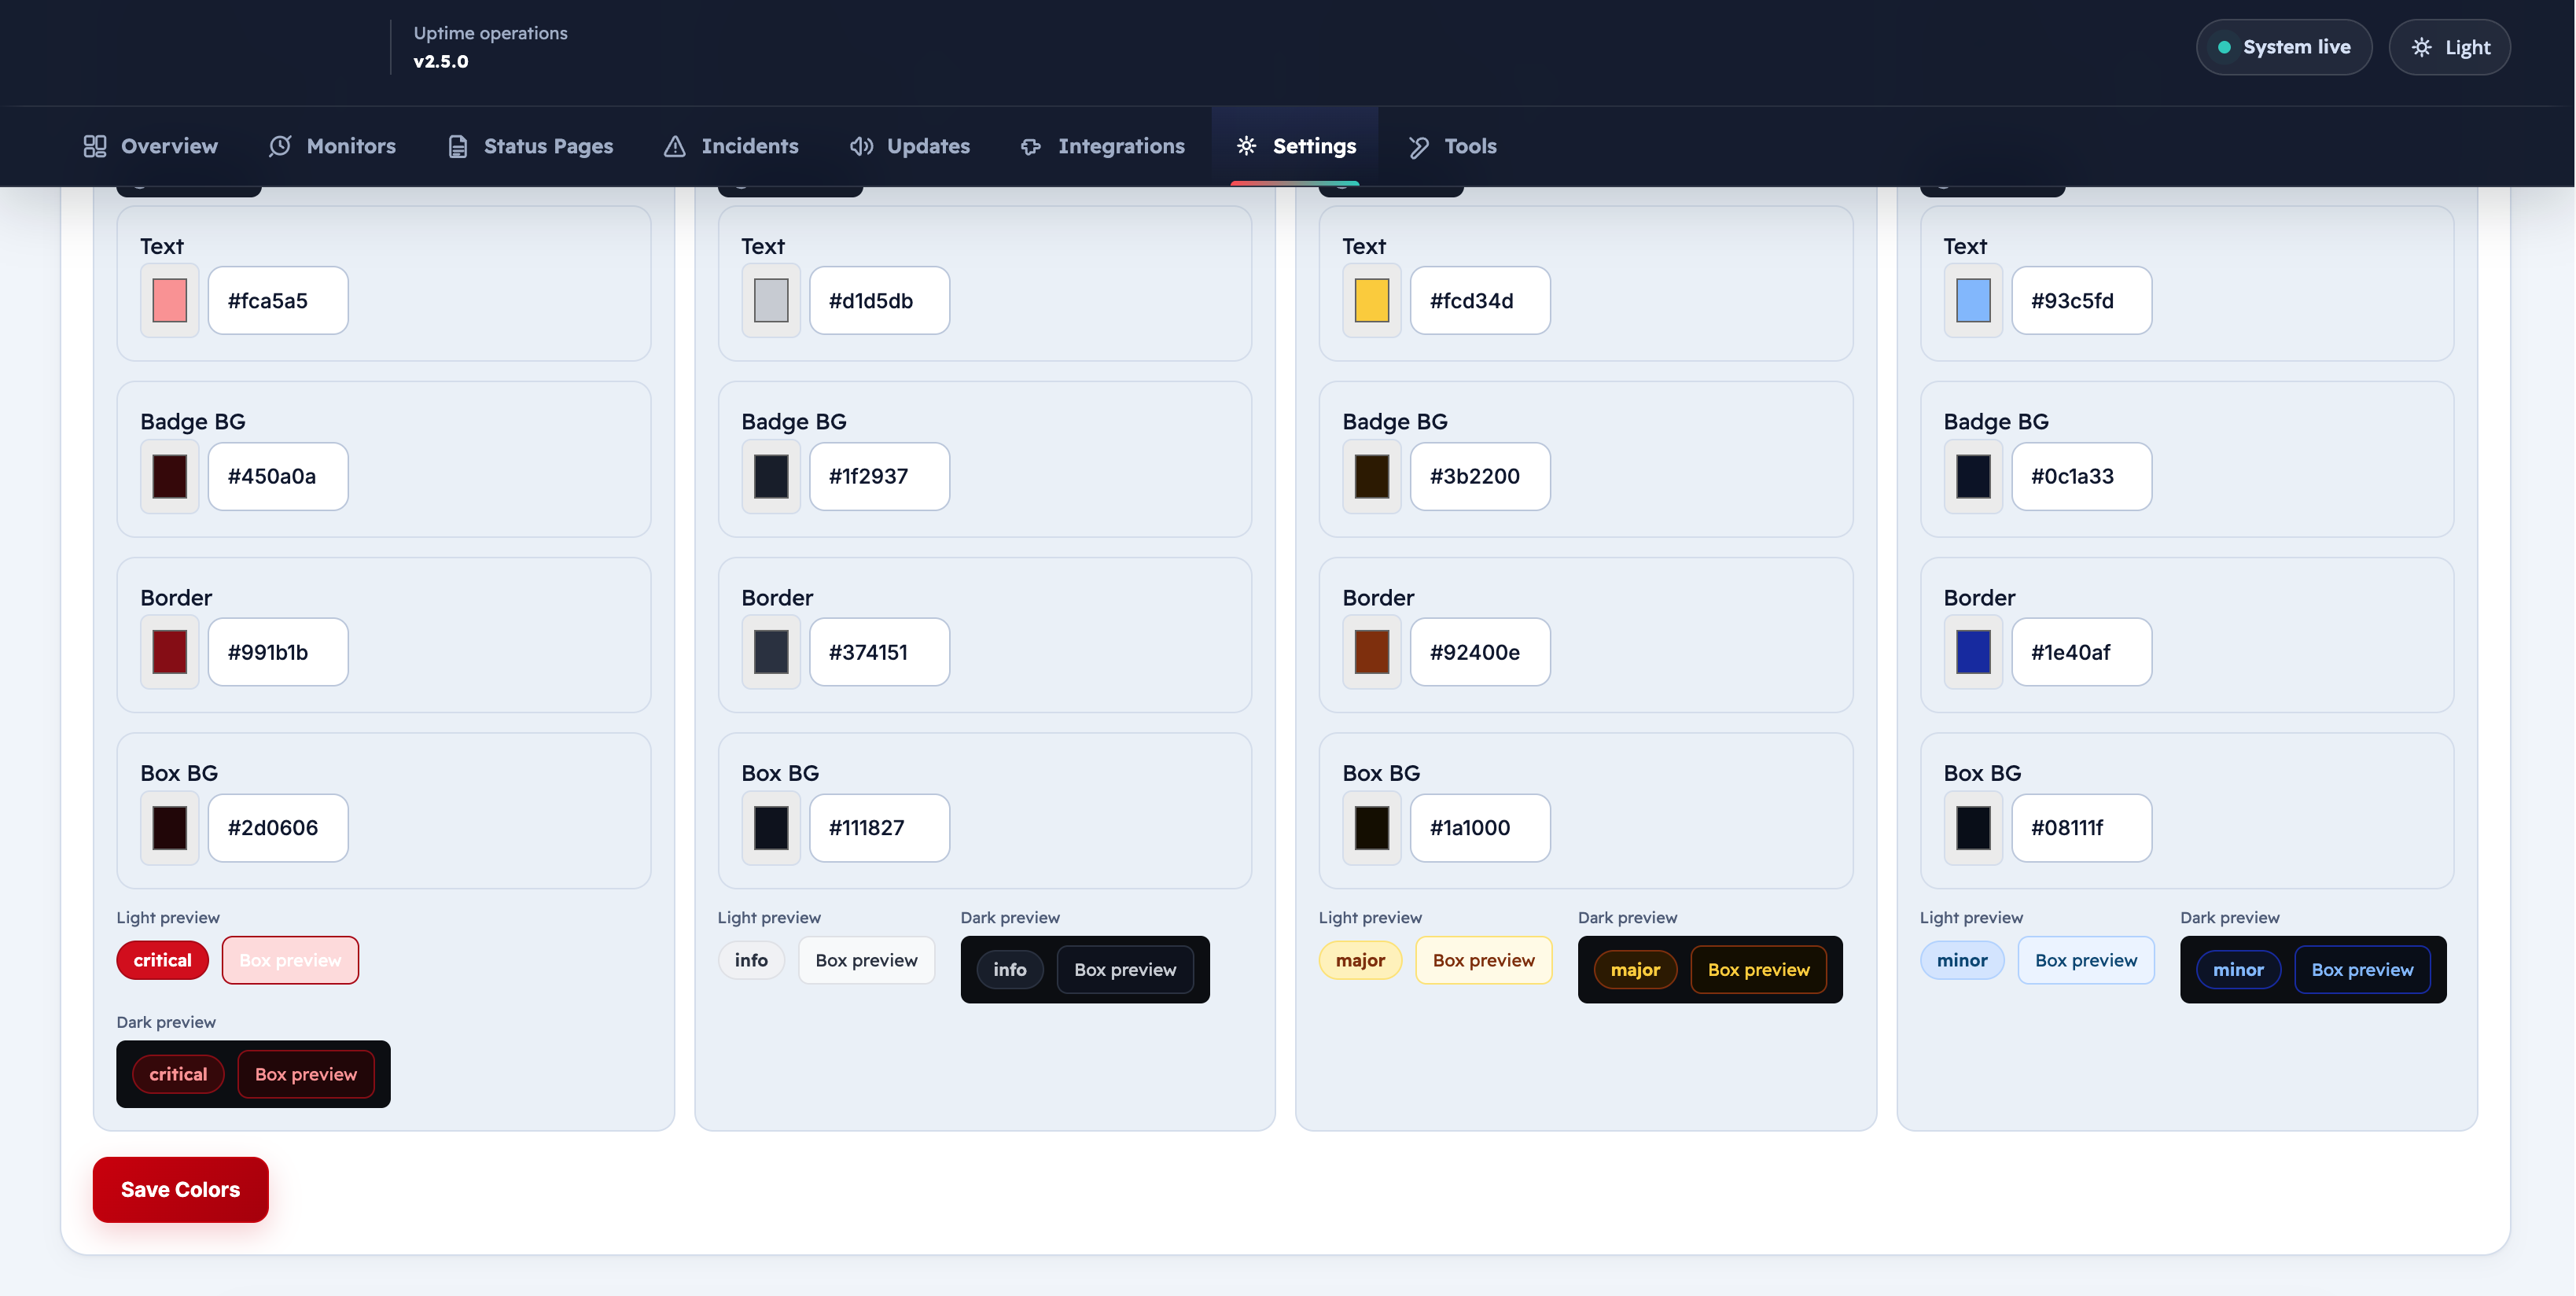
The Colors tab provides a full color editor for incident state badges and severity badges in both light and dark modes.
State Color Sets
Customize the badge appearance for each incident state:
| State | Default light colors |
|---|---|
| Investigating | Amber background |
| Identified | Indigo background |
| Monitoring | Sky blue background |
| Resolved | Green background |
Severity Color Sets
| Severity | Default light colors |
|---|---|
| Critical | Red background |
| Major | Amber background |
| Minor | Blue background |
| Info | Gray background |
Each color set has four customizable fields:
| Field | What it controls |
|---|---|
| Text Color | Badge label color |
| Background Color | Badge fill color |
| Border Color | Badge border color |
| Box Background | Card/box background tint |
A live preview is shown as you edit.
Notifications Settings
Settings → Notifications
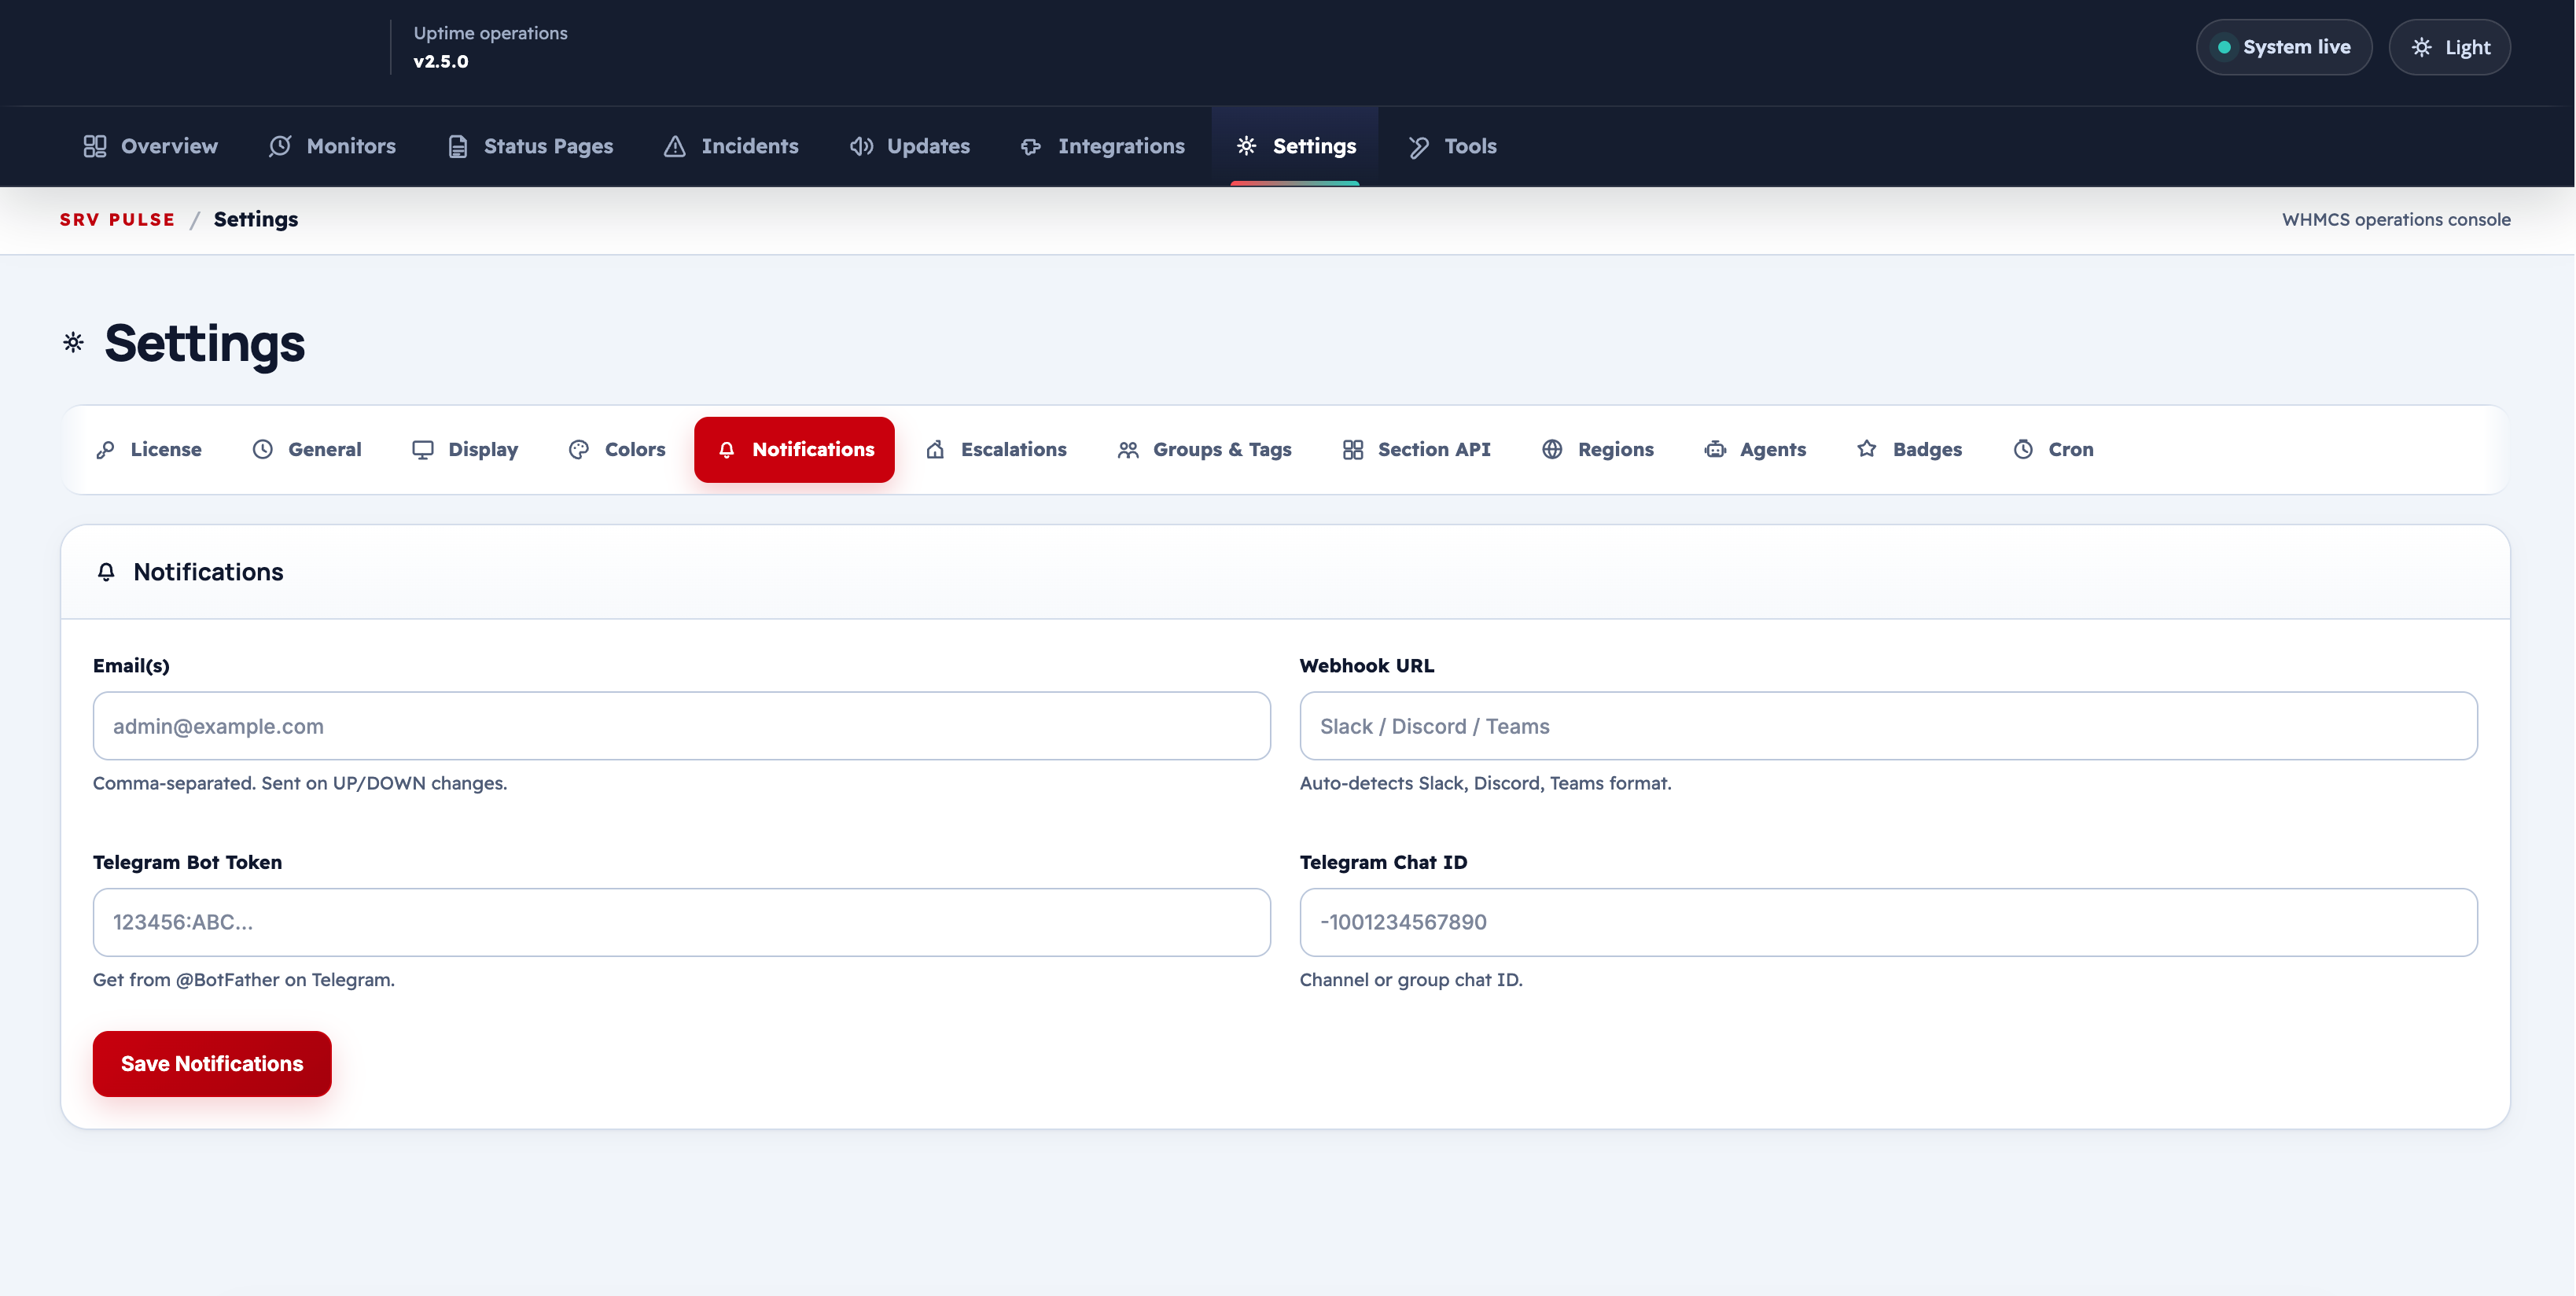
| Channel | Configuration |
|---|---|
| Uses WHMCS mail settings; no additional configuration needed | |
| Webhook | Enter a webhook URL (must use HTTPS); the addon sends a JSON POST on each status change |
| Telegram | Enter your Telegram Bot Token and Chat ID |
Note
Webhook URLs must use HTTPS. Plain HTTP webhook targets are rejected for security reasons.
Escalation Rules
Settings → Escalations
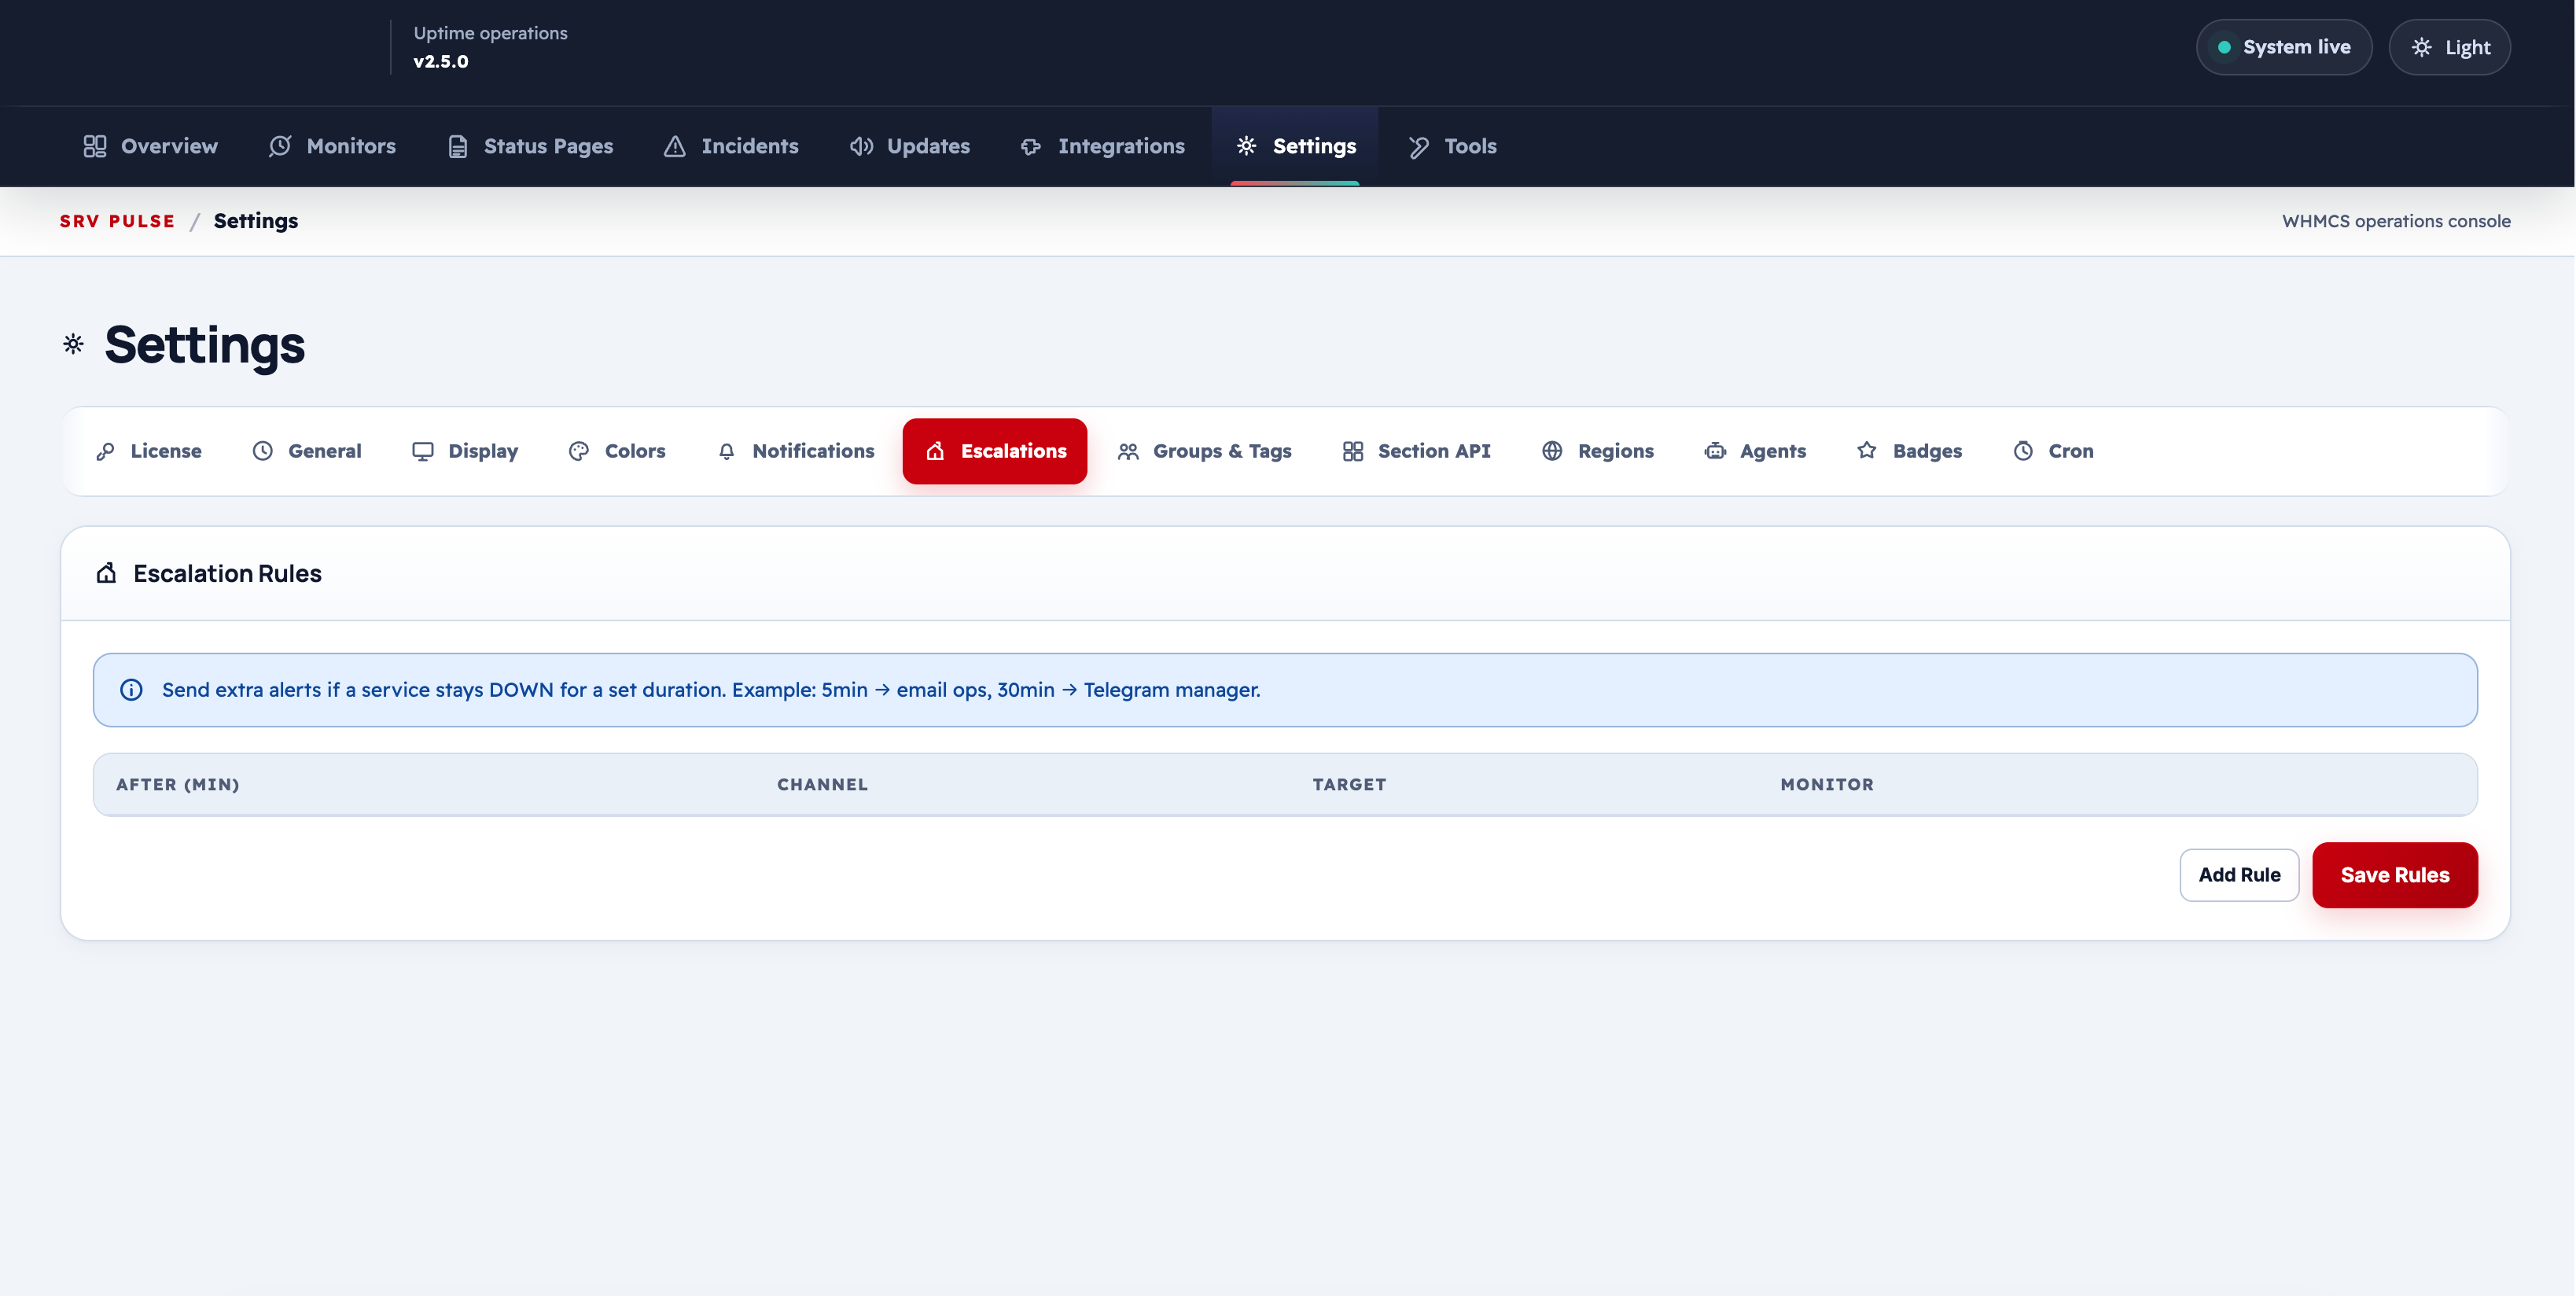
Escalation rules trigger additional notifications when a monitor has been down for a set duration.
| Field | Description |
|---|---|
| Monitor | Apply to a specific monitor, or leave blank for all monitors |
| After (minutes) | Minutes of continuous downtime before escalation triggers |
| Channel | email, webhook, or telegram |
| Target | Email address, webhook URL, or Telegram chat ID |
| Enabled | Toggle without deleting |
Groups & Tags
Settings → Groups & Tags
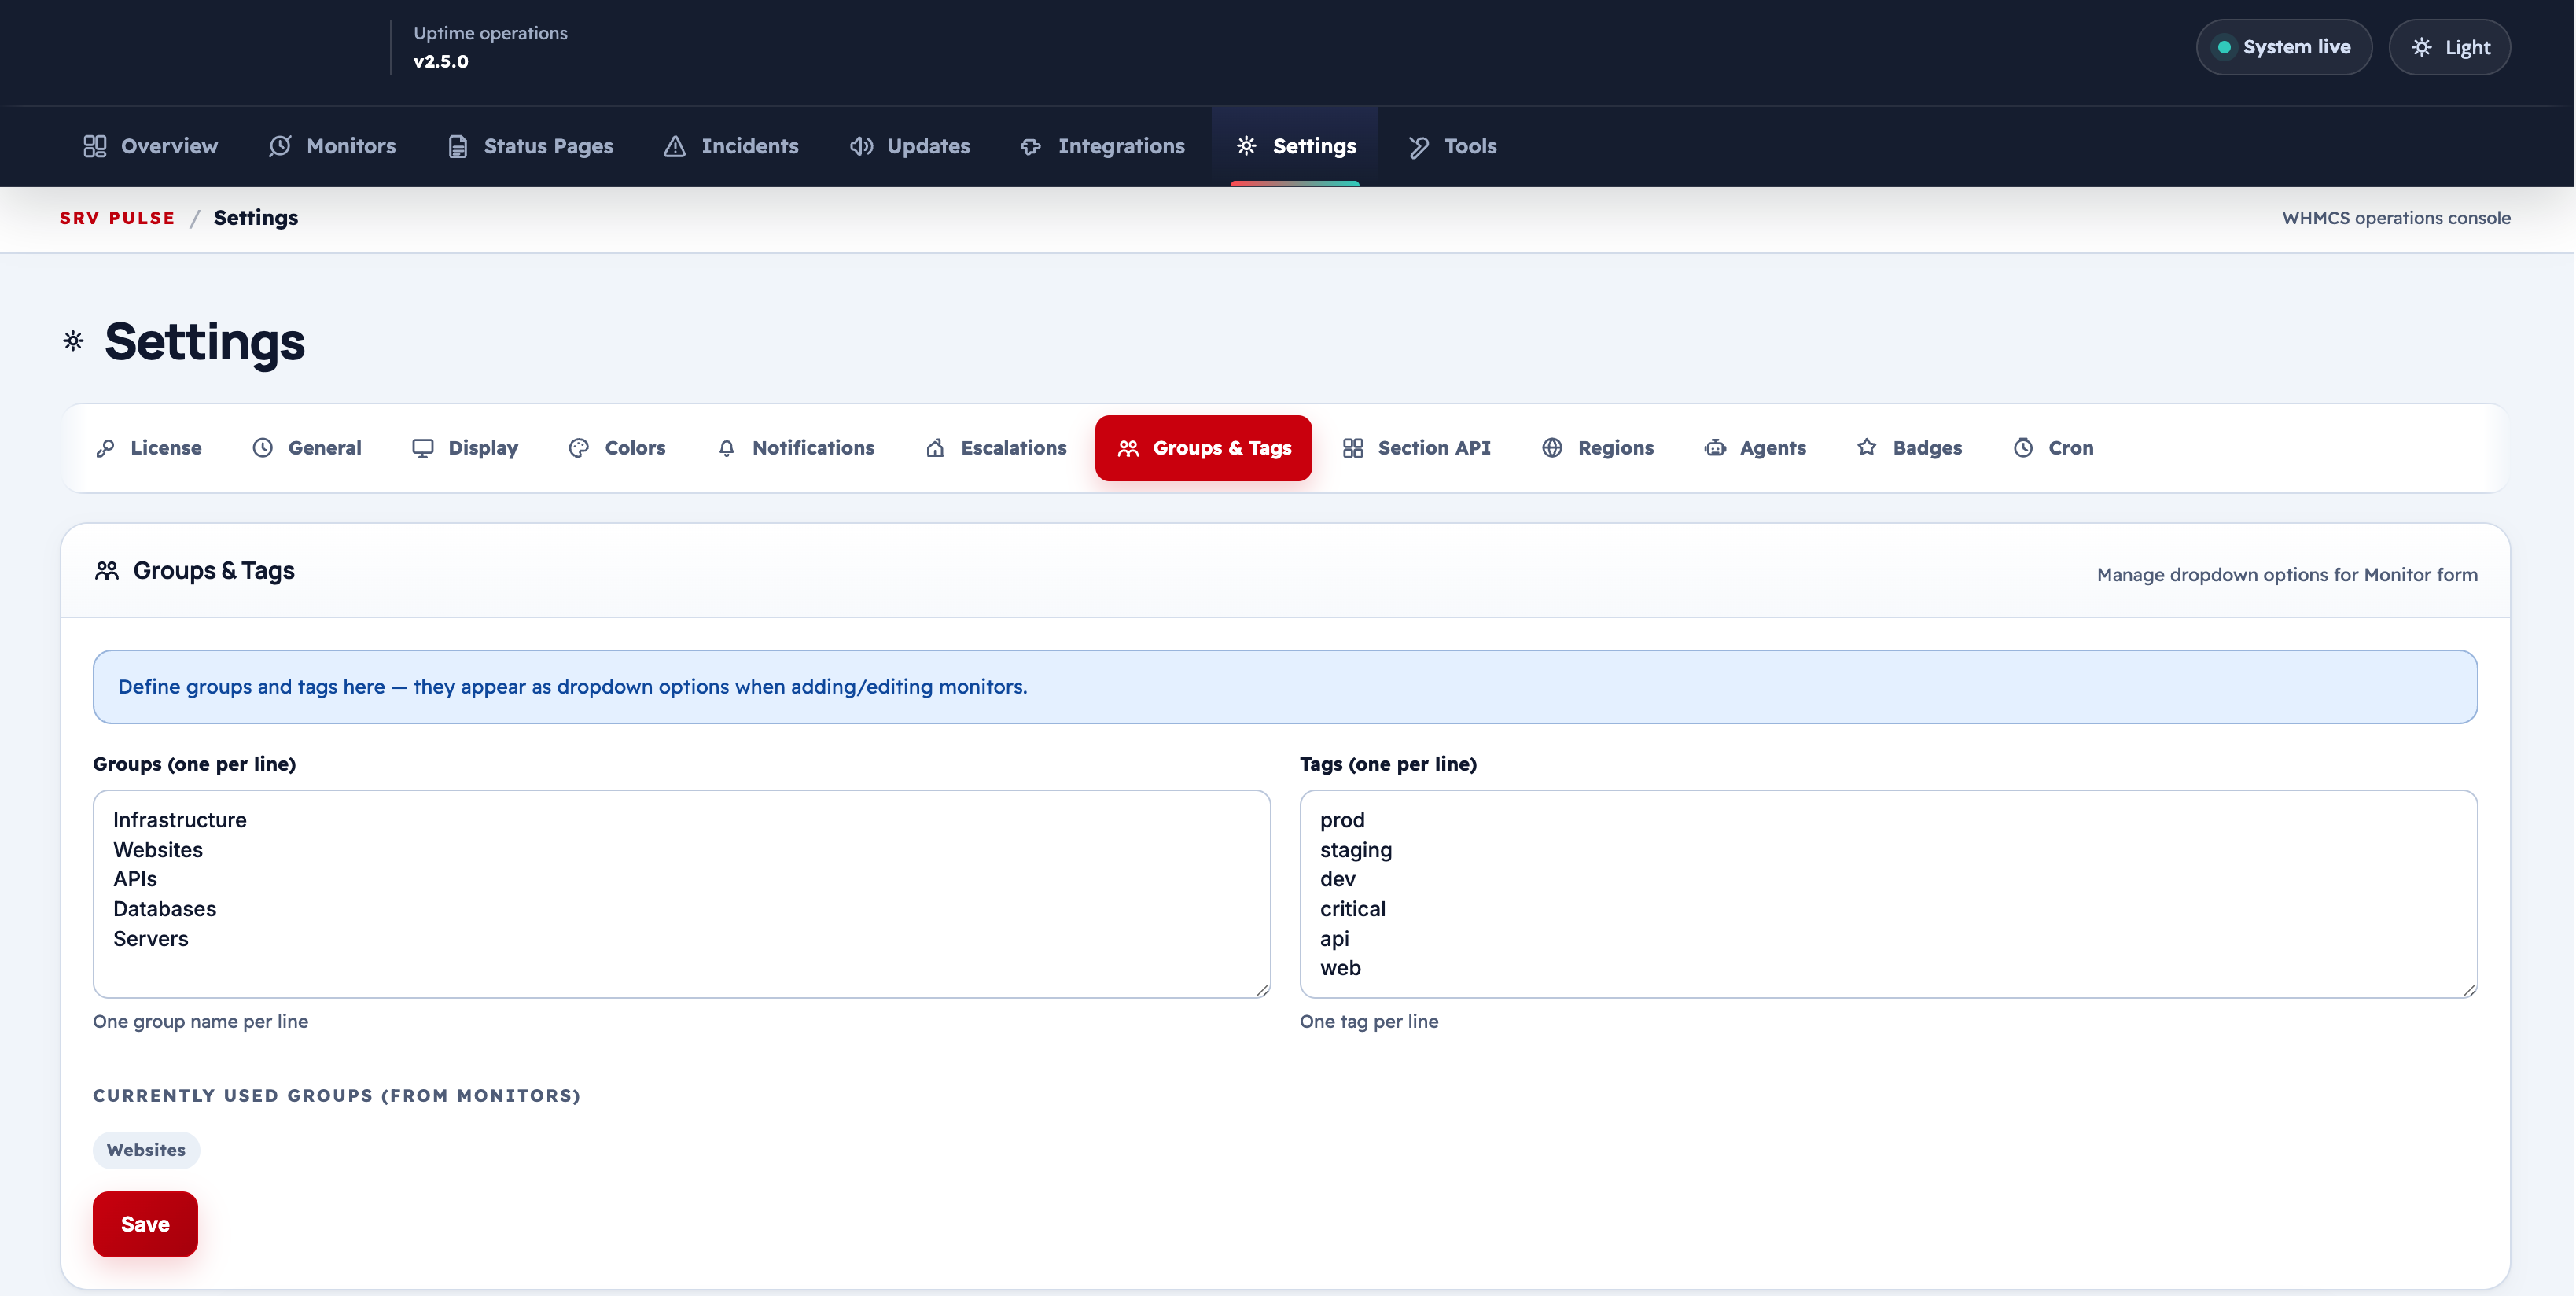
| Feature | Description |
|---|---|
| Groups | Create and reorder display groups for each status page; drag to set the sort order |
| Tags | Manage the tag list for quick filtering in the monitor list |
Groups affect only the visual organisation on the status page. Tags are for internal admin filtering.
Section API Settings
Settings → Section API
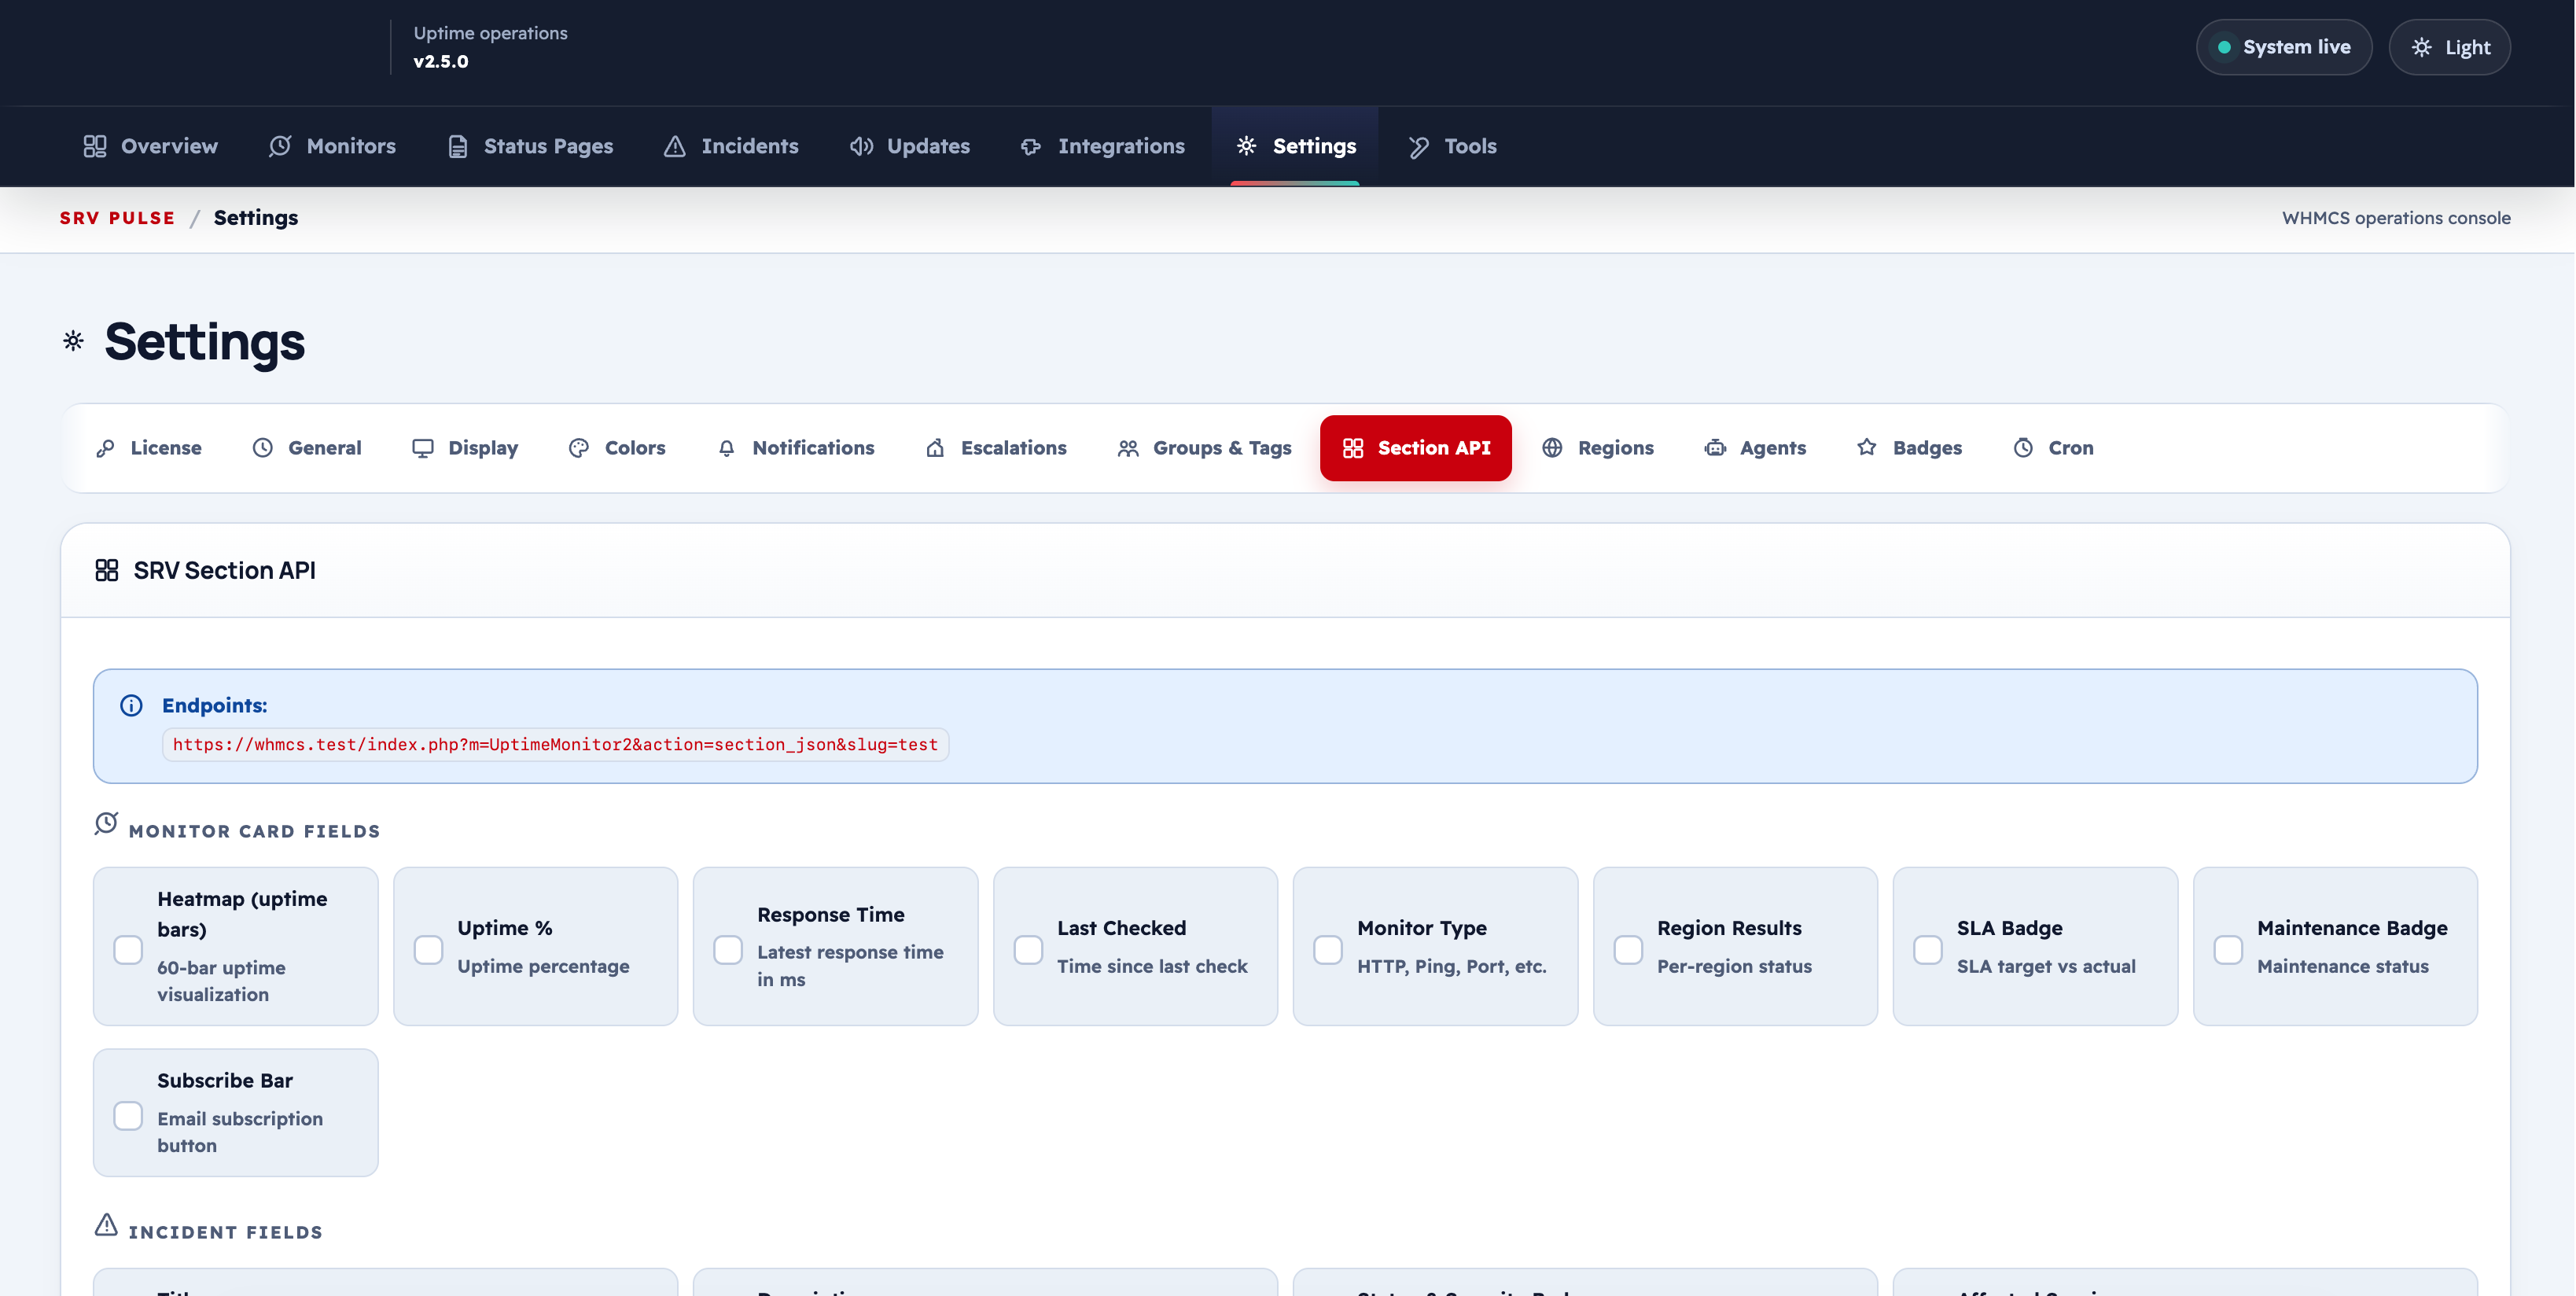
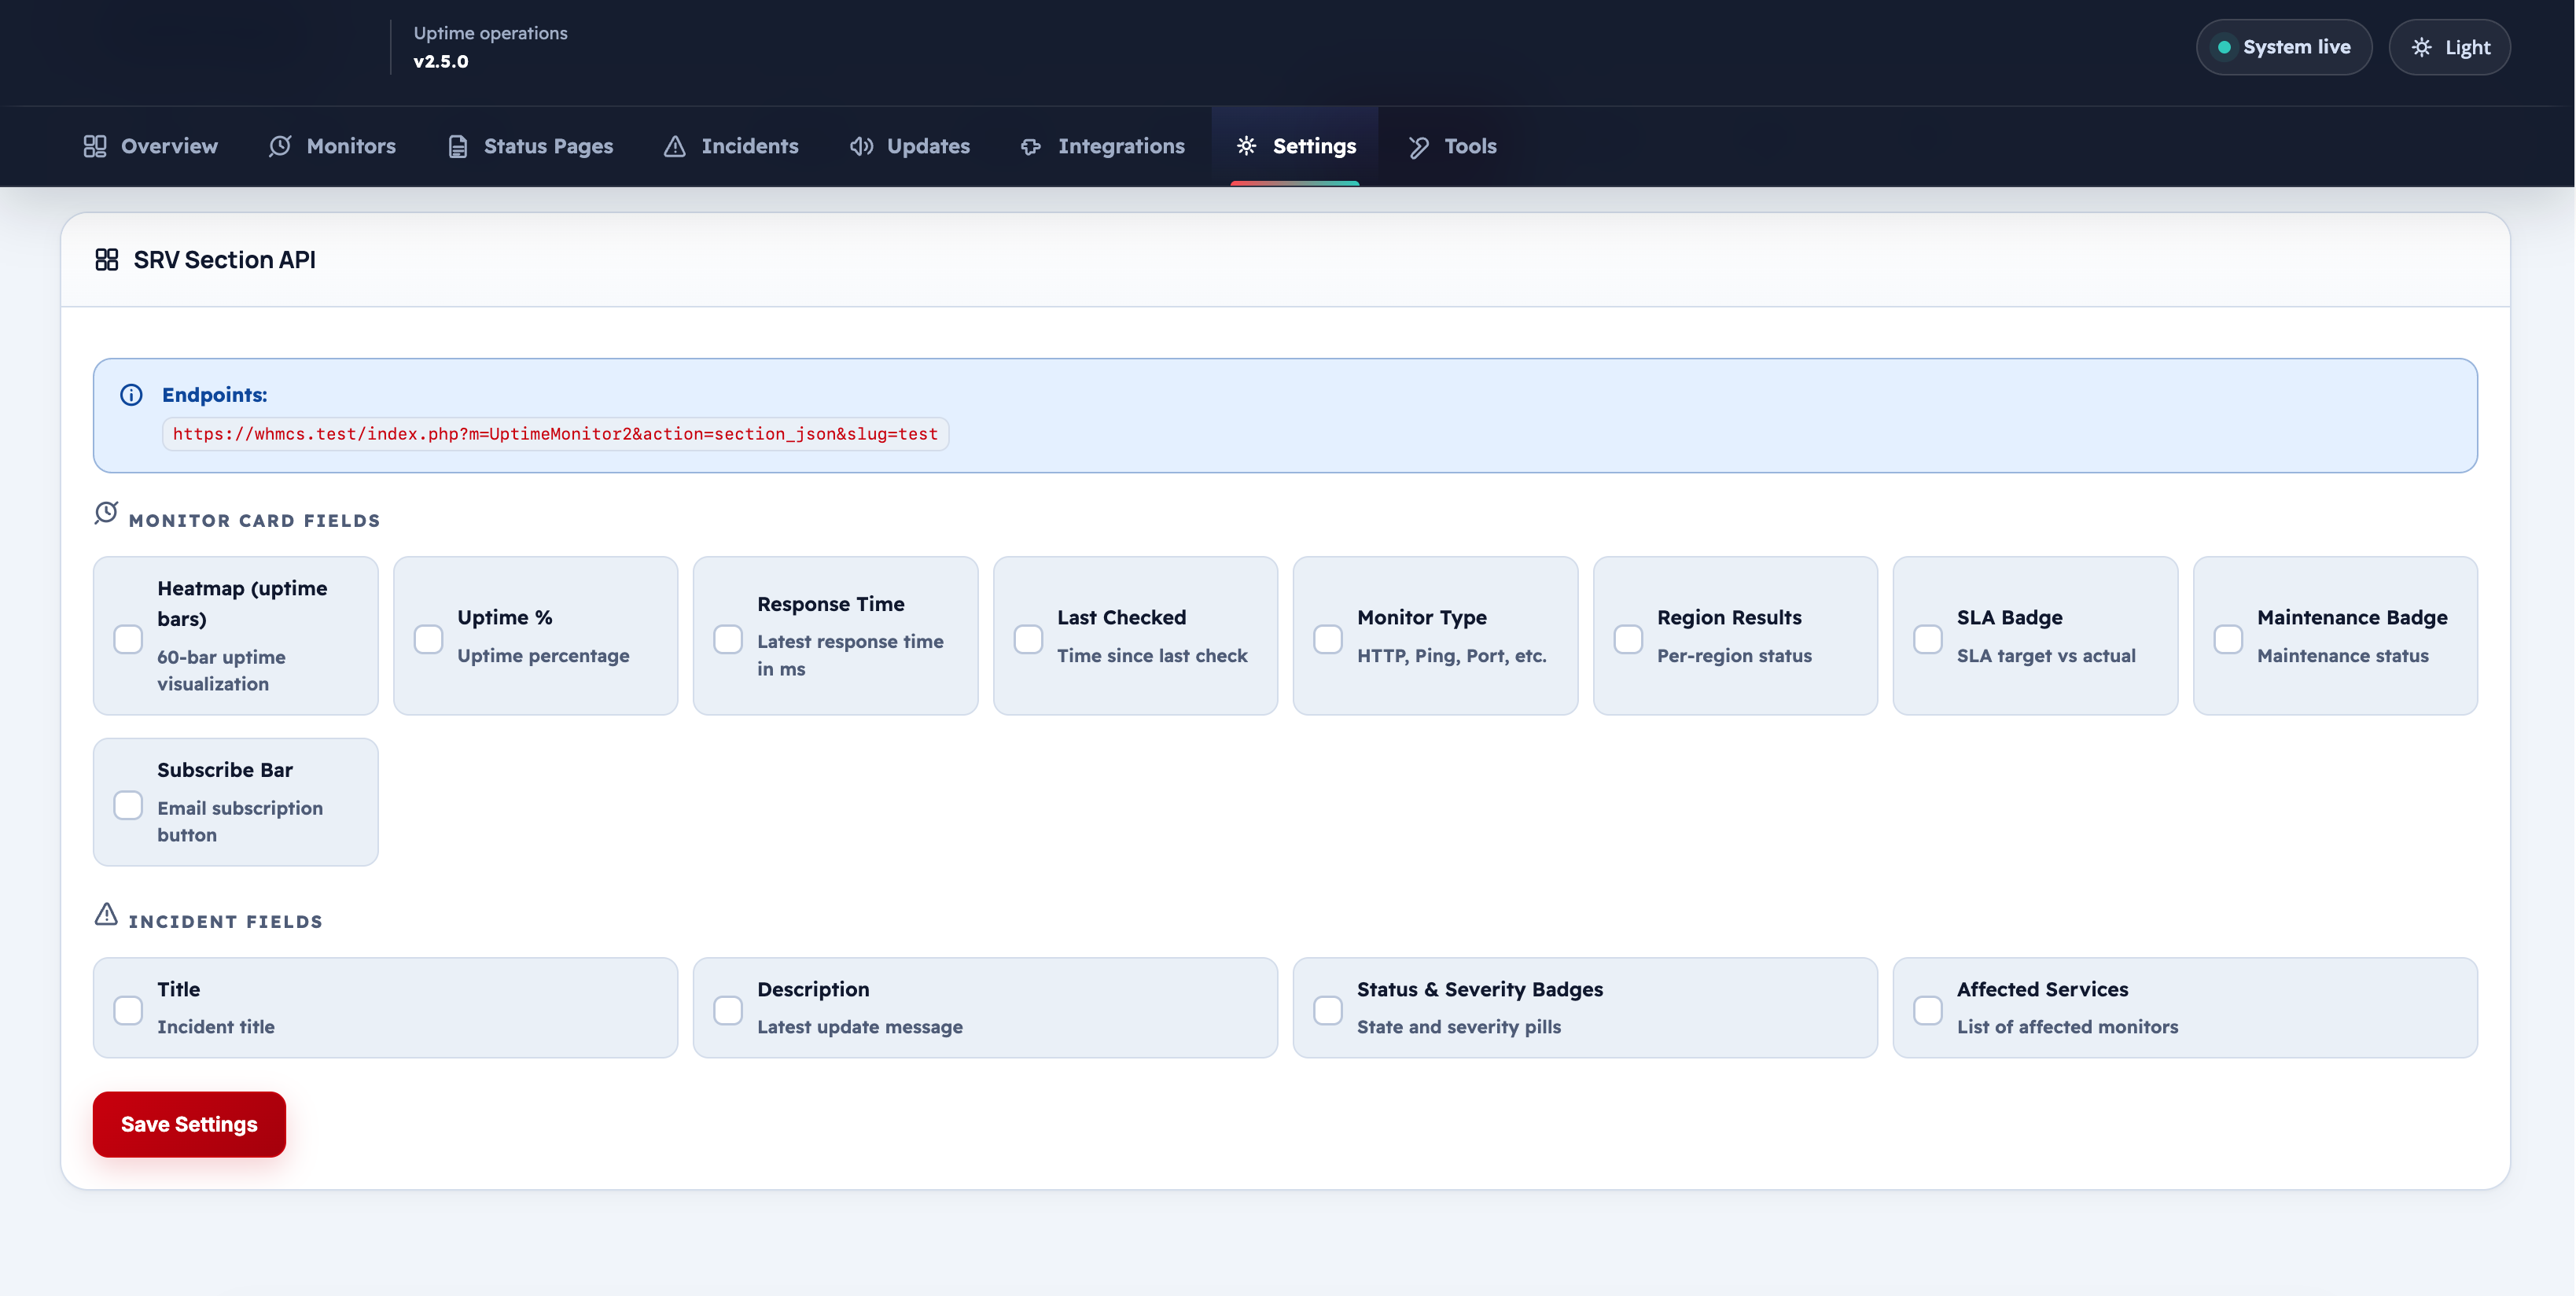
The Section API provides a JSON endpoint compatible with the Lagom WHMCS theme's section display widget. Configure which monitor and incident fields are included in the response.
| Field | Description |
|---|---|
| Endpoint URL | The public JSON URL for the Lagom section integration |
| Card Fields | Which monitor data fields to include in the JSON card output |
| Incident Fields | Which incident fields to include |
Agents Settings (Distributed Agents)
Settings → Agents
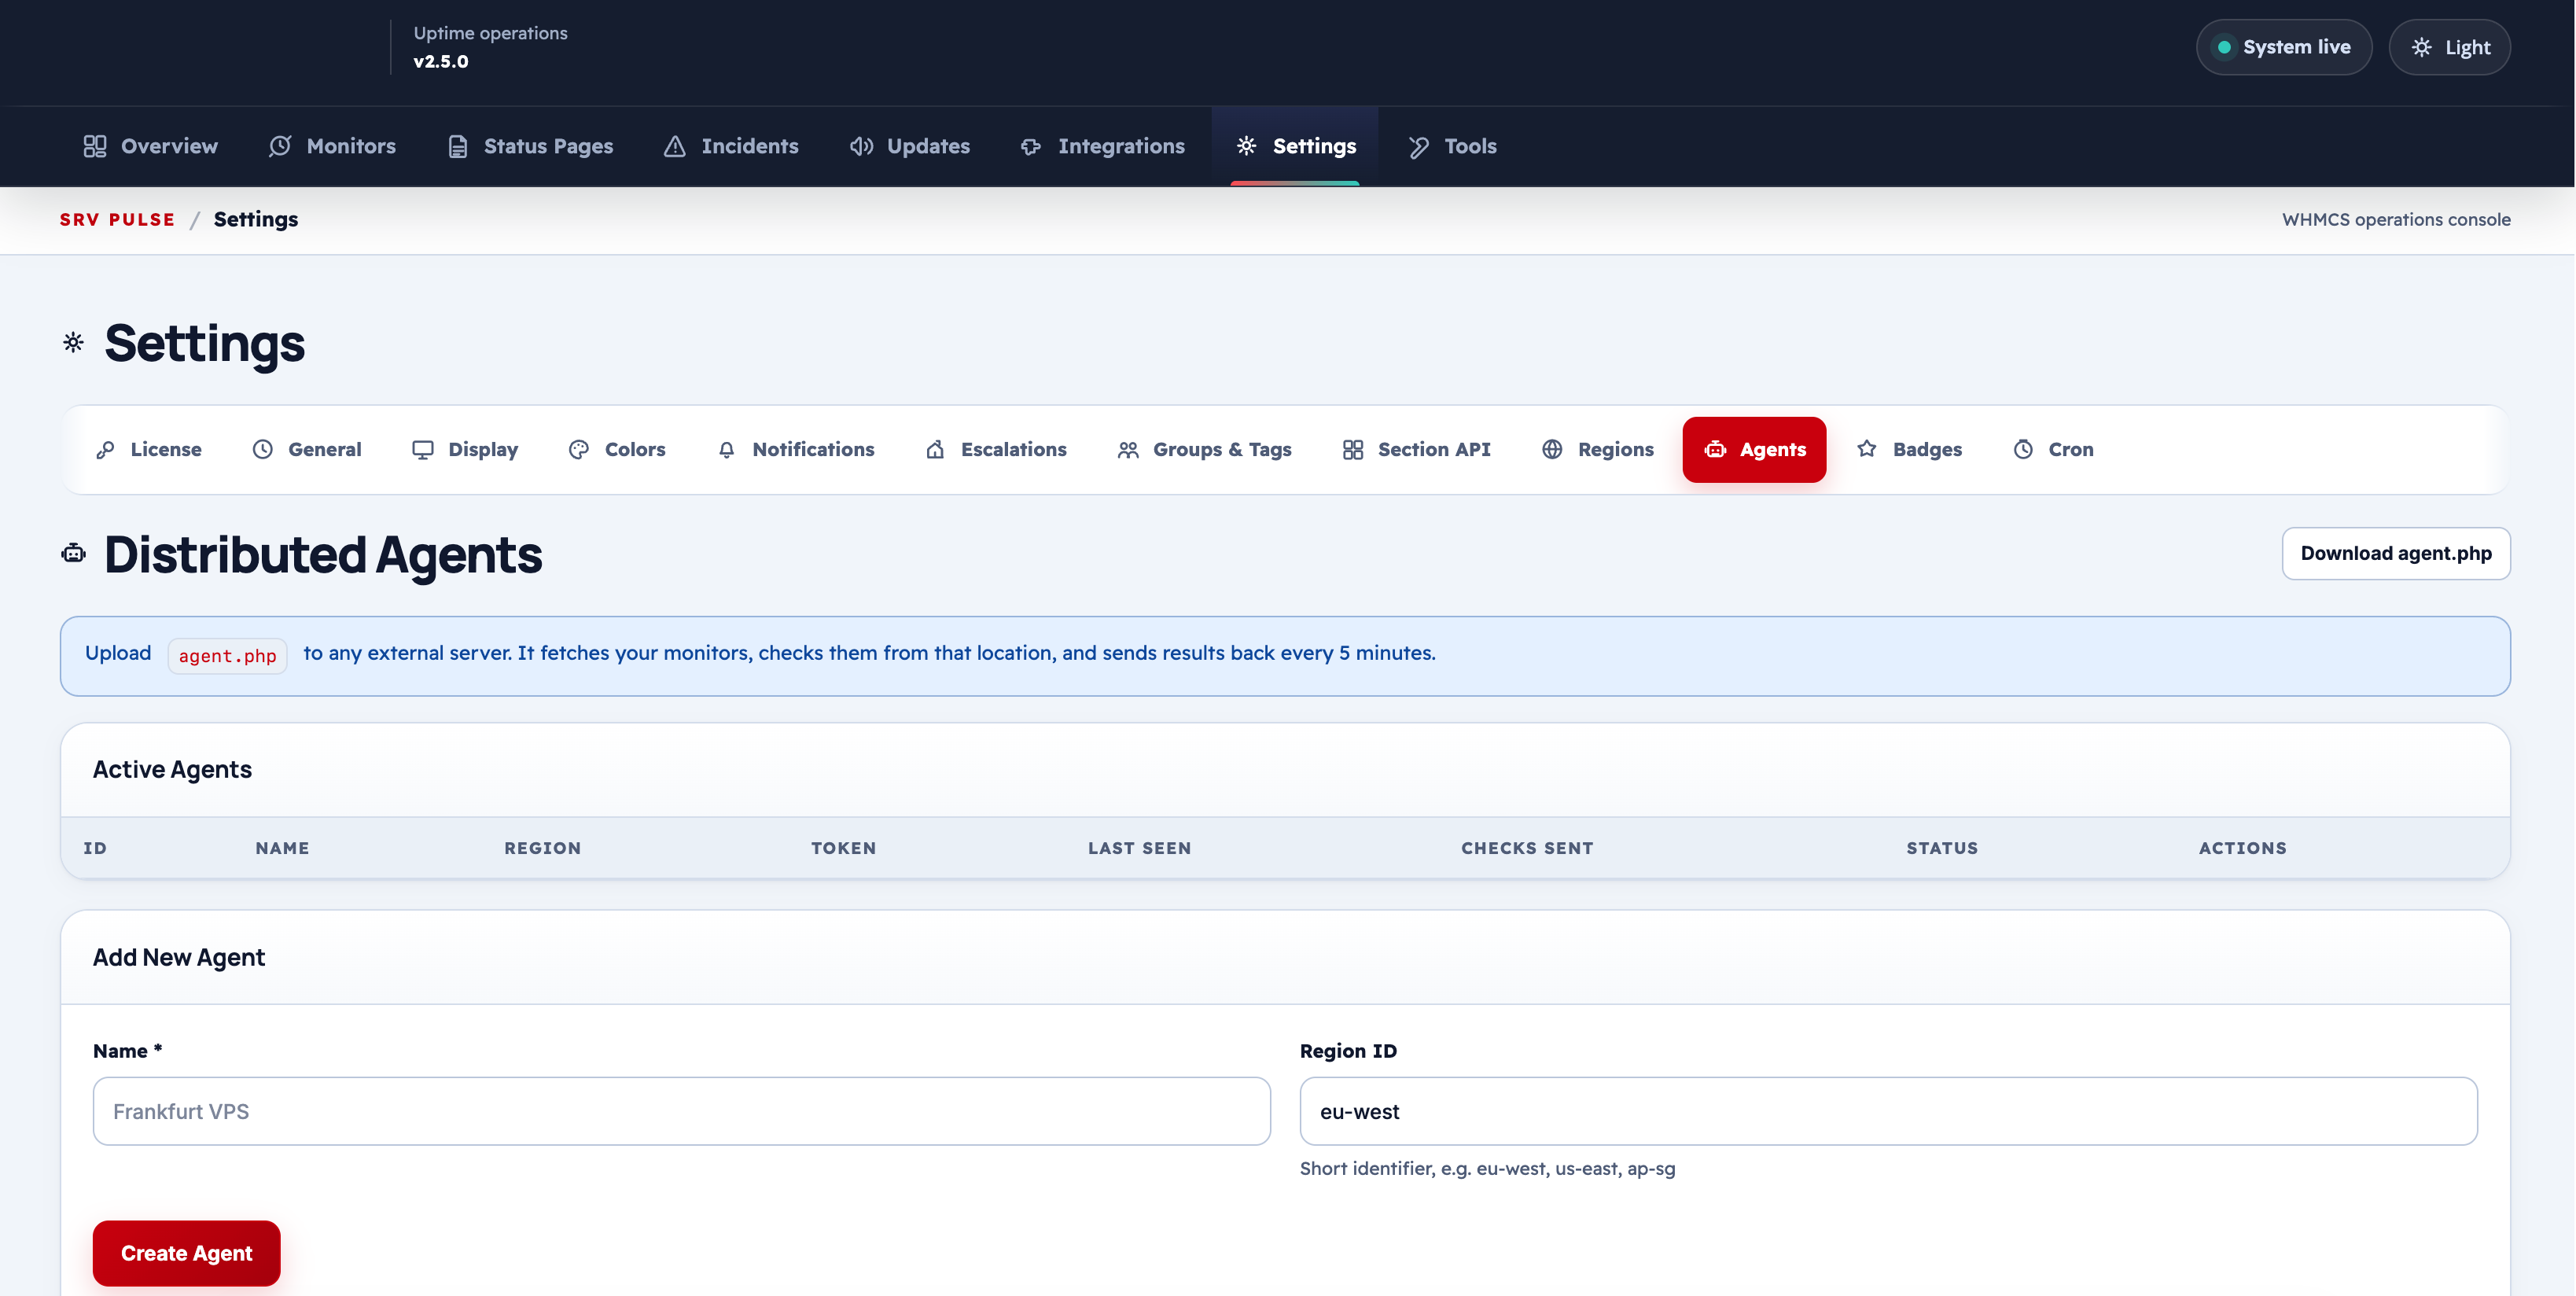
Distributed agents are remote scripts (PHP or Python) that run checks from external servers and submit results back to your main installation.
| Field | Description |
|---|---|
| Agent Name | Friendly label for this agent |
| Region | Region identifier used to match agent results to monitors (e.g. us-east, eu-west) |
| Agent Token | Auto-generated secure token used to authenticate the agent |
| Allowed IP | Optional: restrict submissions to this IP address |
| Enabled | Activate or pause the agent |
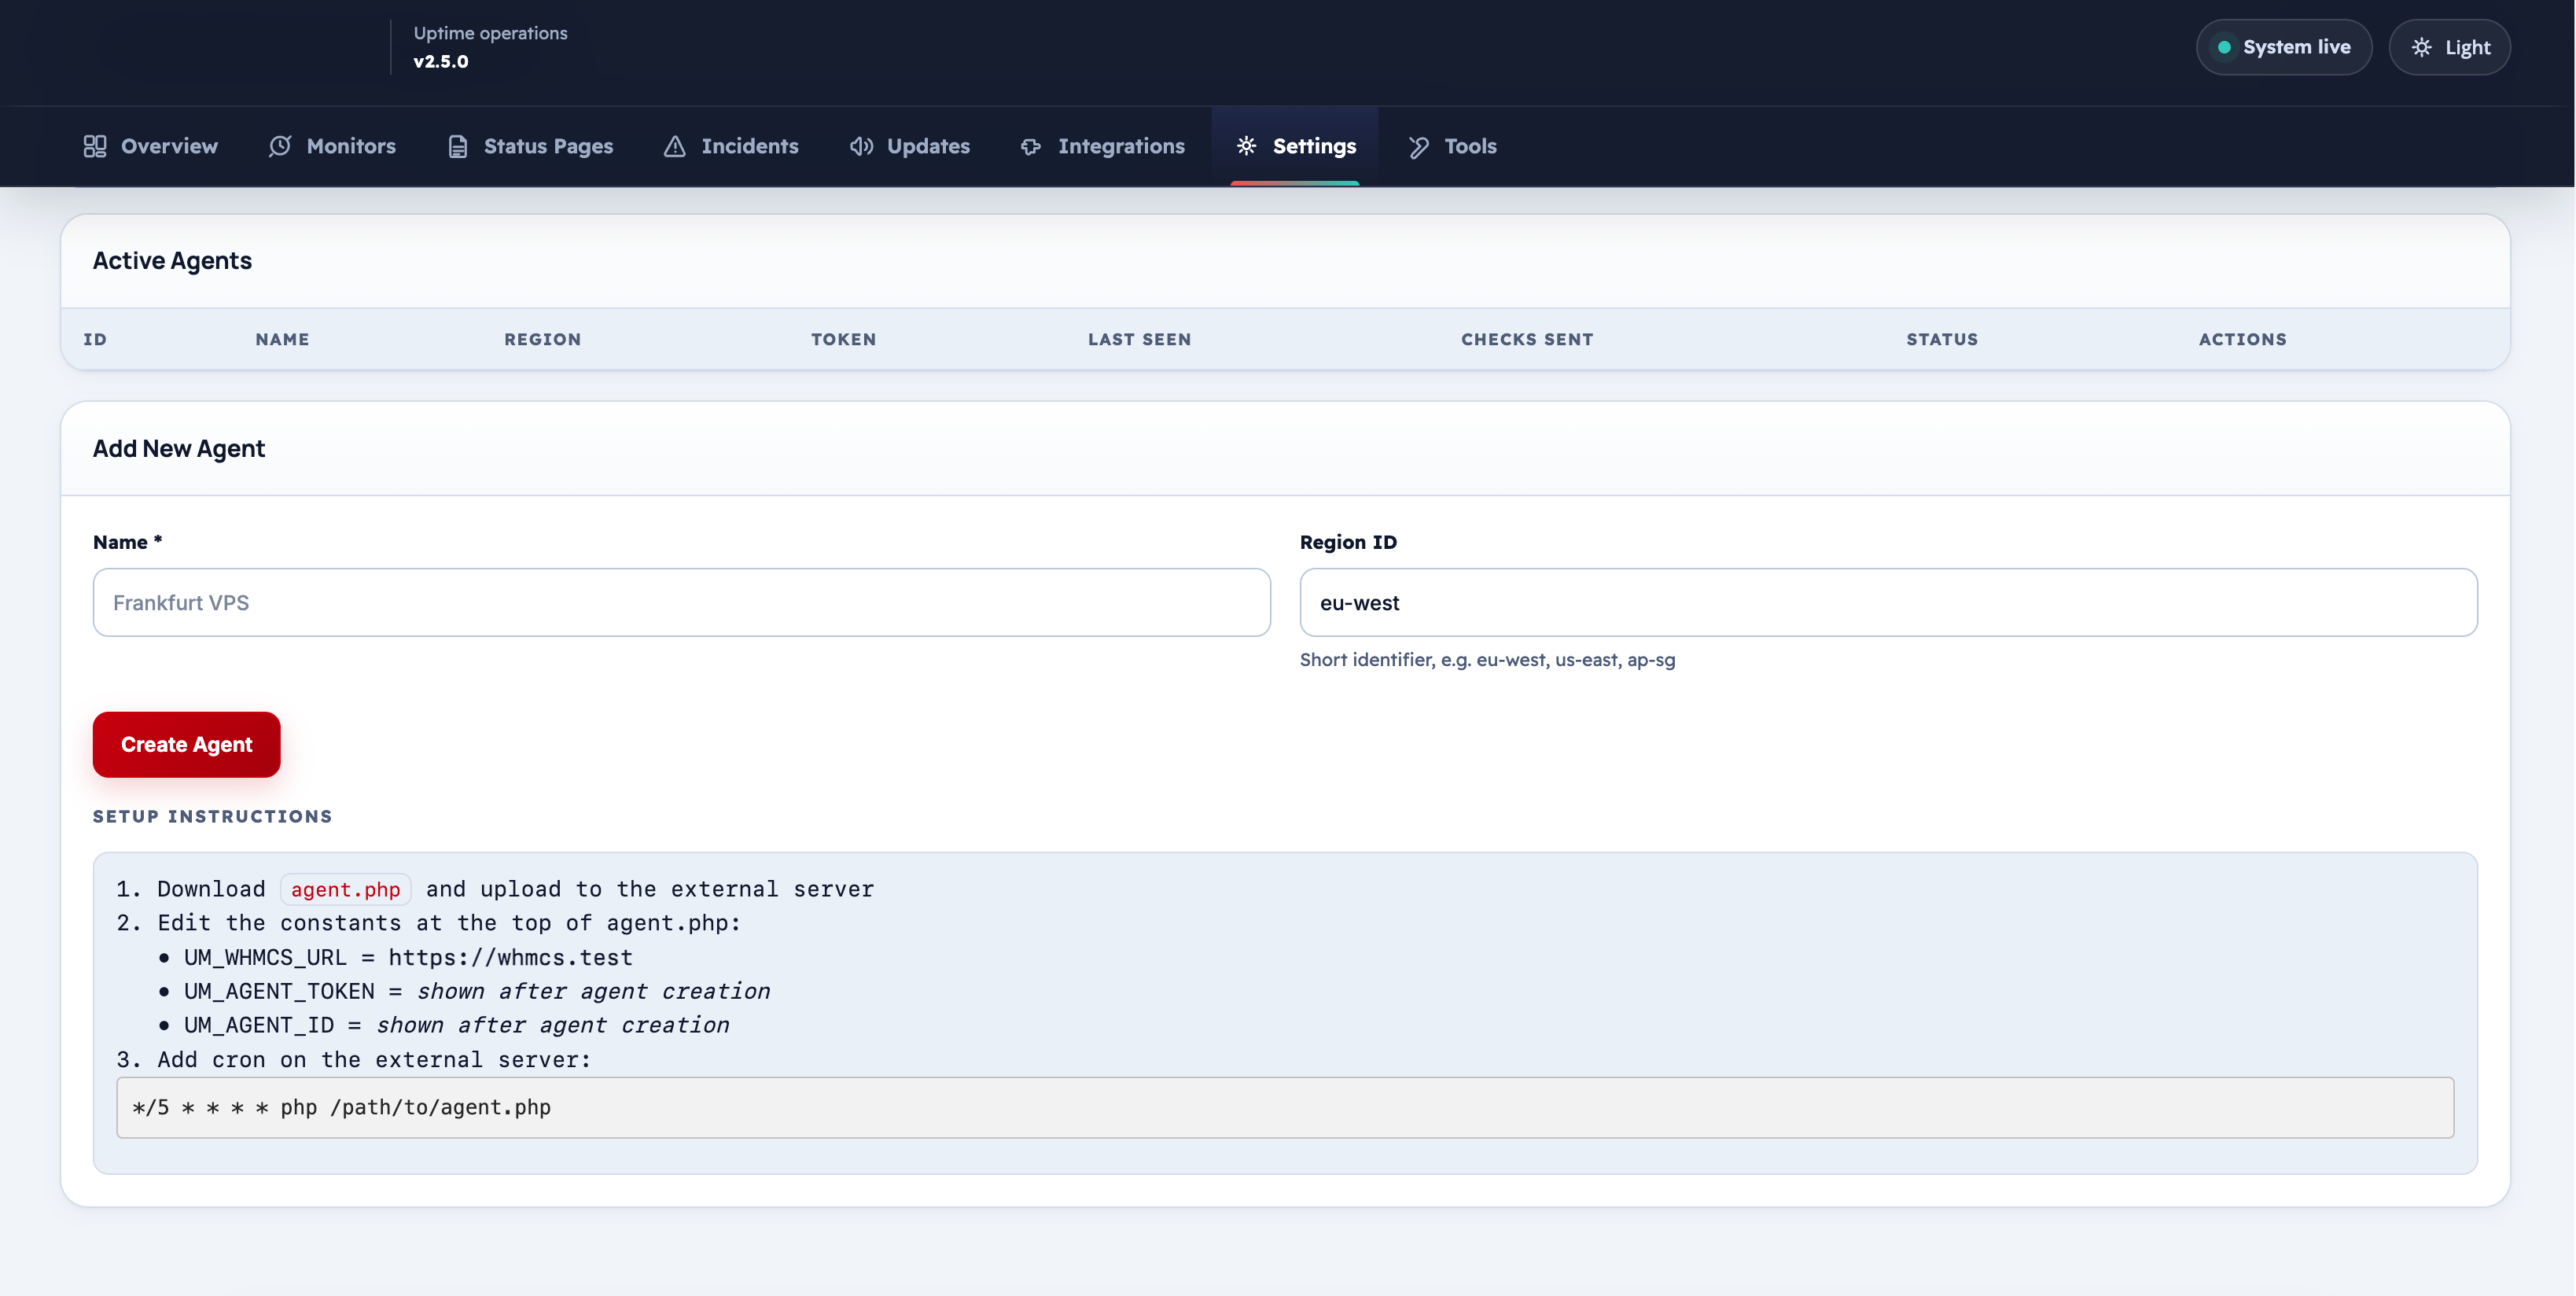
After creating an agent, the setup instructions panel shows the exact command to deploy the agent script on the remote server, including the token and endpoint URL.
[!IMPORTANT] Keep agent tokens confidential. Anyone with a valid token and agent ID can submit check results.
Badges Settings
Settings → Badges
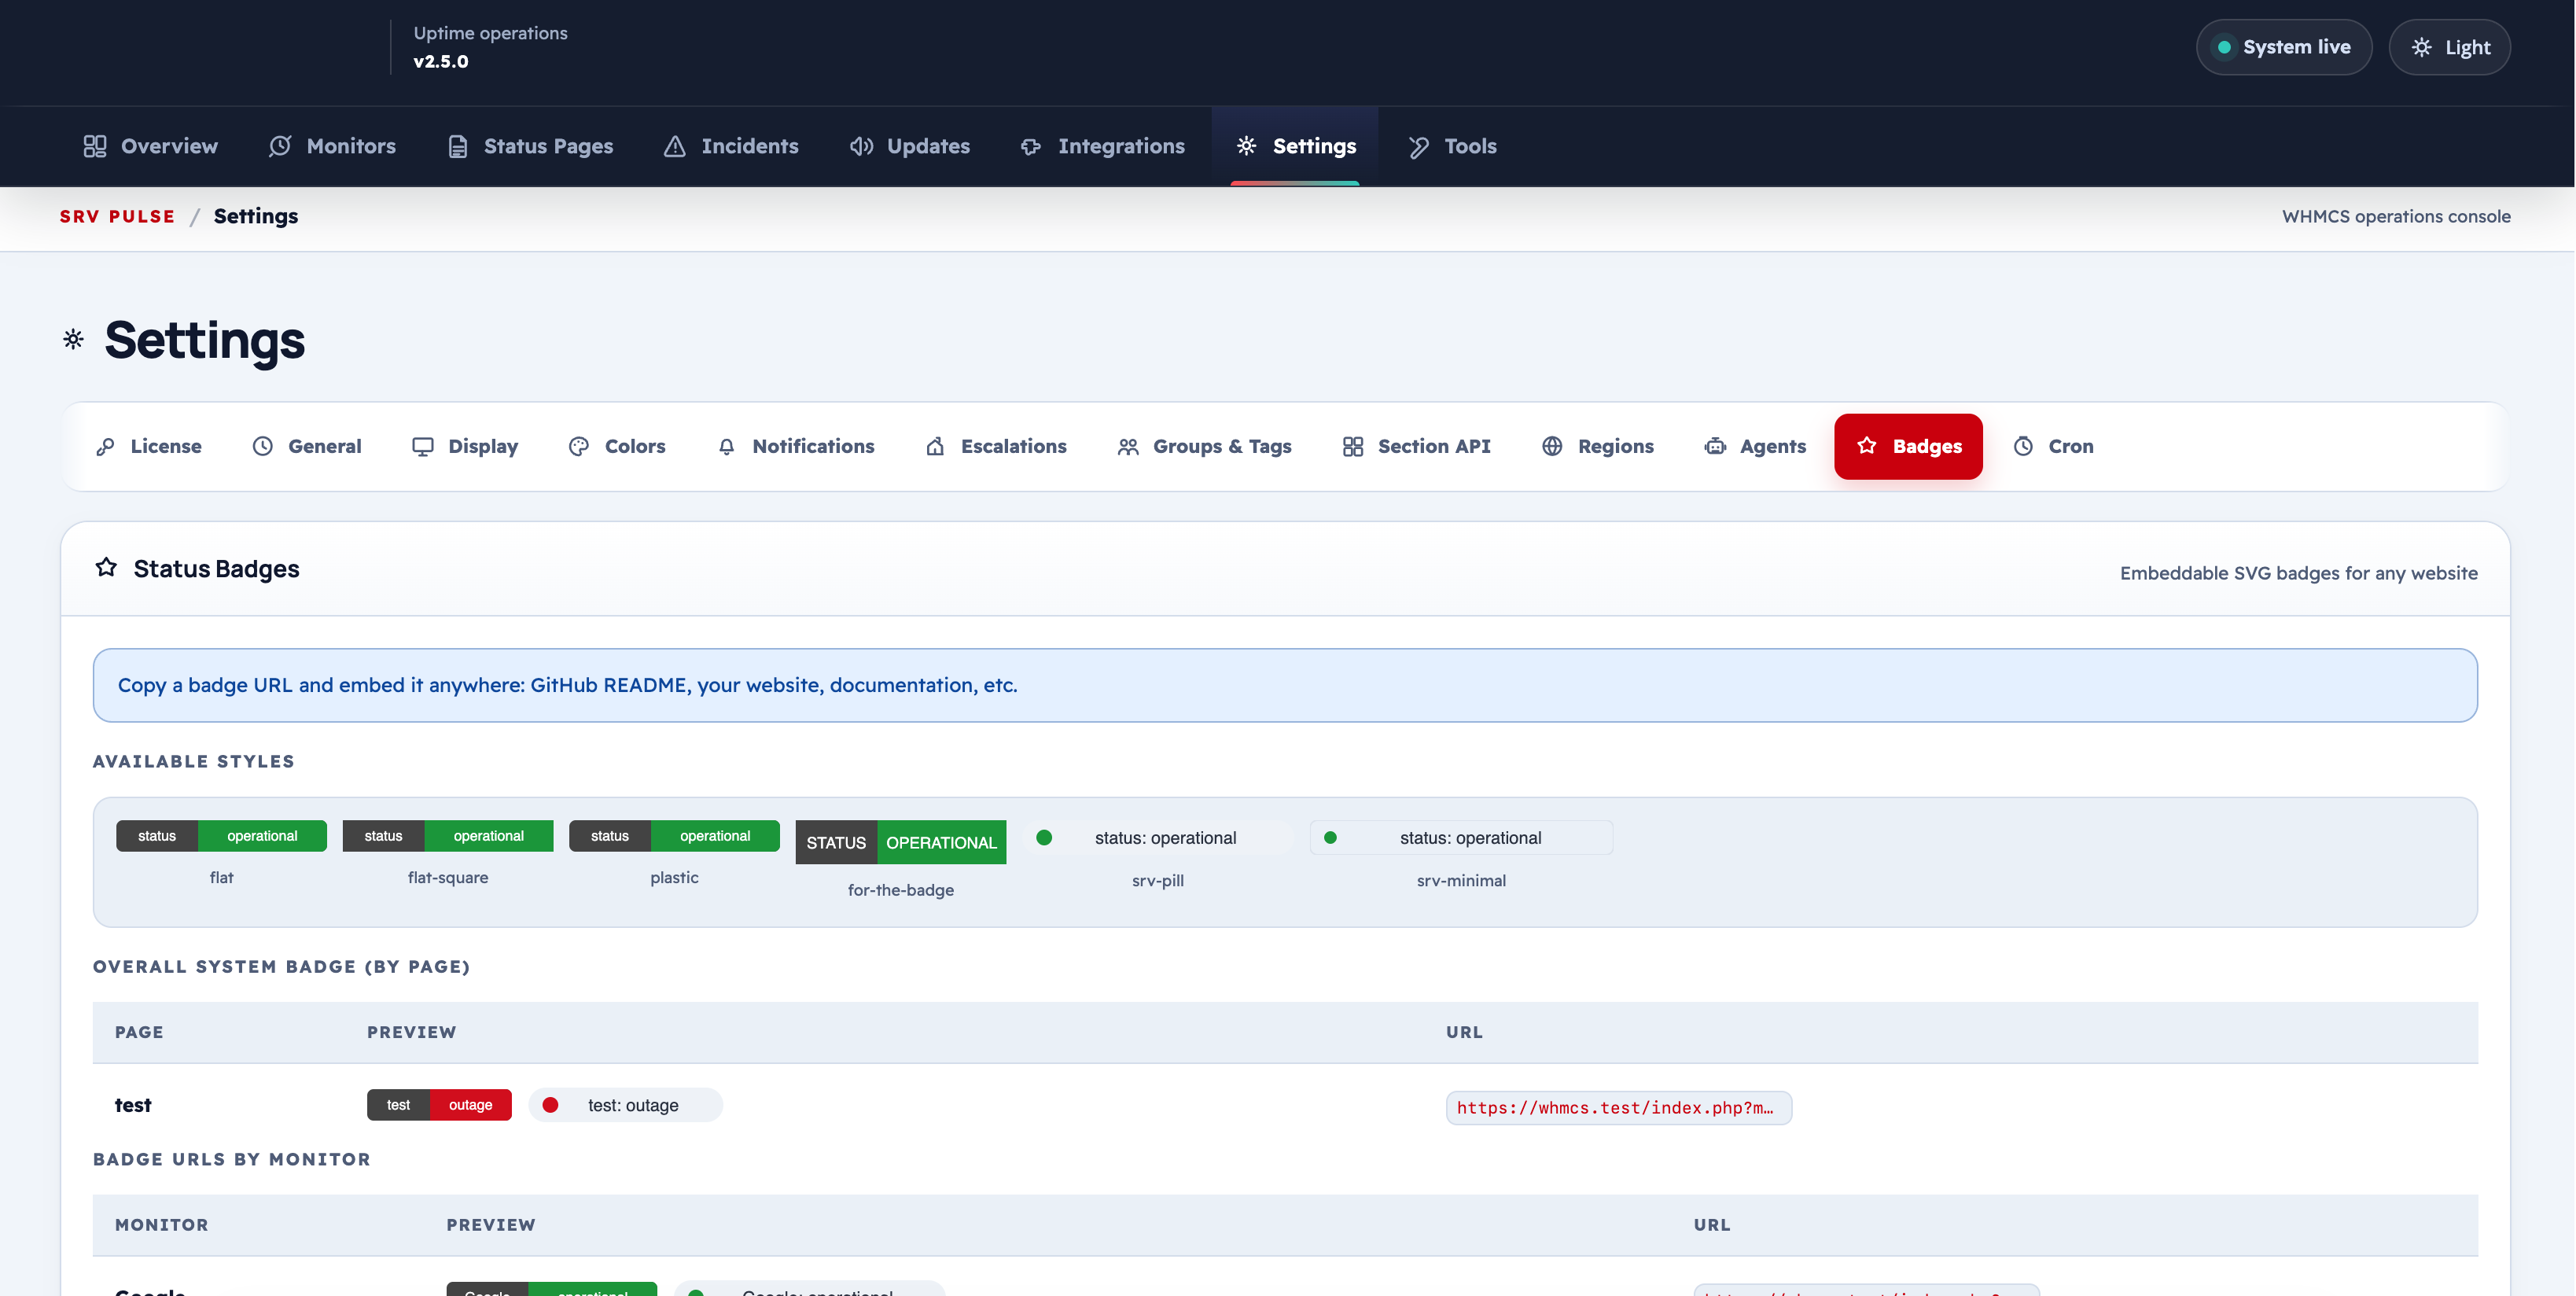
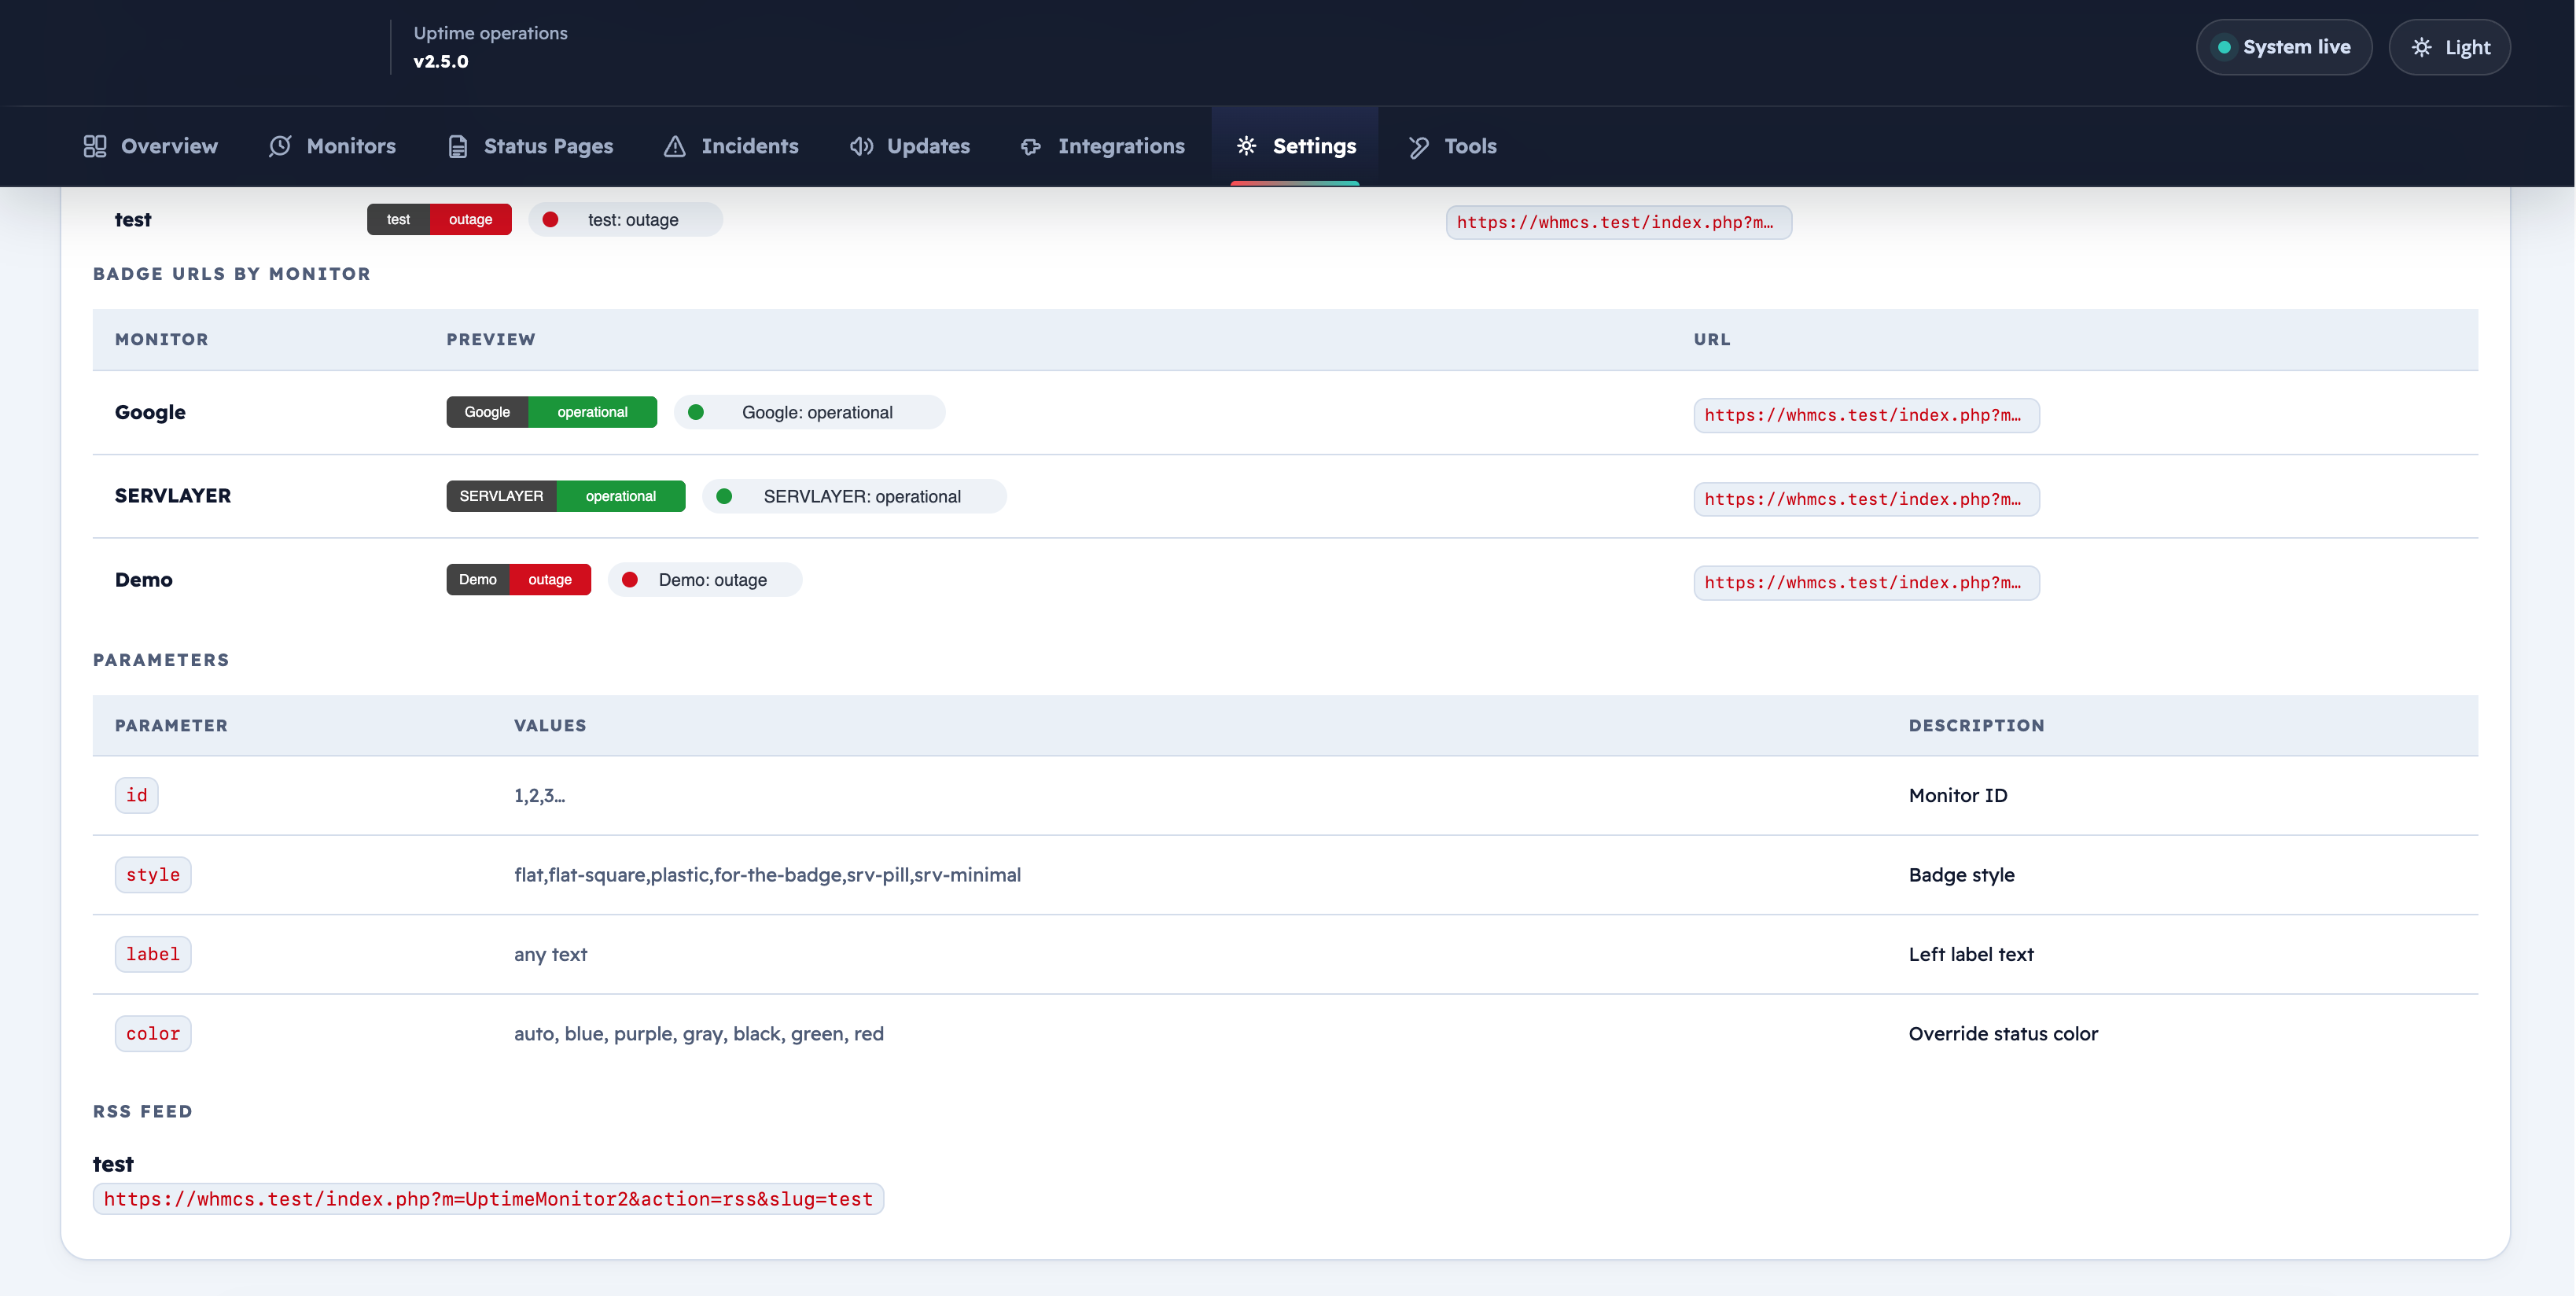
Status badges are embeddable SVG images that show the real-time status of a monitor or a status page.
Badge Types
| Type | Description |
|---|---|
| Page Badge | Shows overall page status (All Systems Operational / Outage) |
| Monitor Badge | Shows status of a single monitor (Up / Down) |
Badge Styles
| Style | Appearance |
|---|---|
flat |
Flat colored label |
flat-square |
Flat with squared corners |
for-the-badge |
Large bold badge |
plastic |
3D shaded badge |
Badge URL Parameters
| Parameter | Description |
|---|---|
style |
Badge style (see above) |
label |
Custom left-side label text |
color |
Override badge color |
RSS Feed
Each status page has a public RSS feed URL for subscribers who prefer feed readers over email. The feed includes the most recent incidents and their current states.
Cron Settings
Settings → Cron
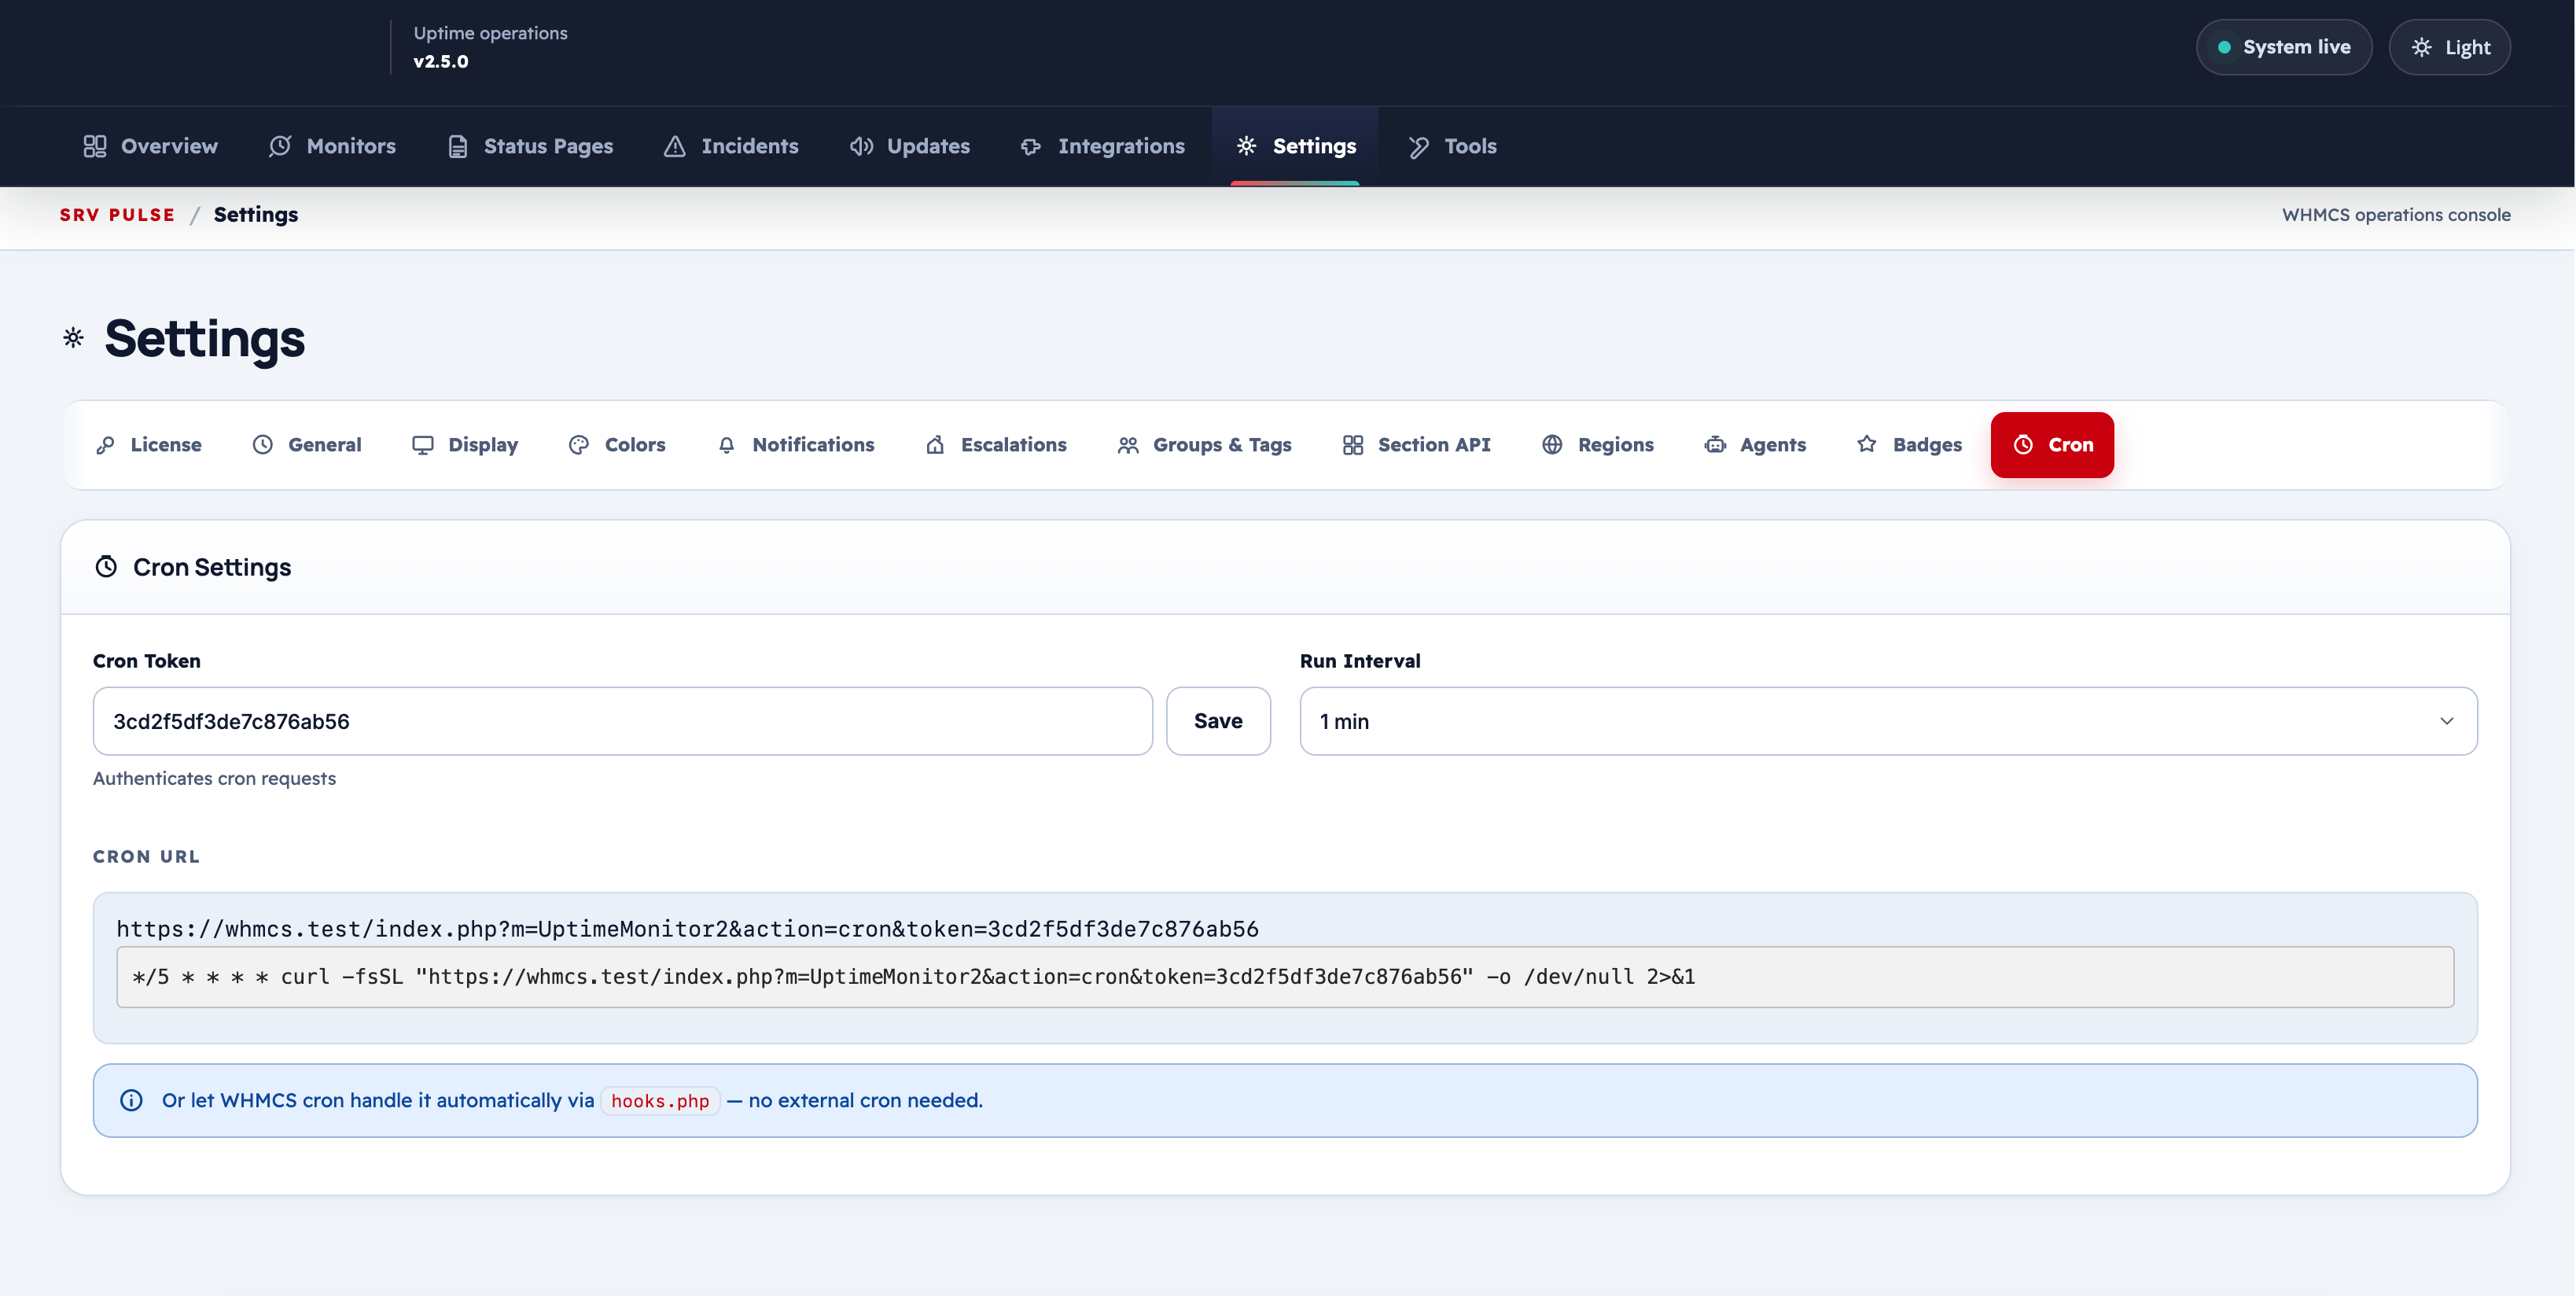
| Field | Description |
|---|---|
| Cron Token | The security token included in the cron URL; regenerate to invalidate old URLs |
| Check Interval | Default check interval (seconds) applied to new monitors |
| Cron URL | The full URL to call from an external cron job |
| WHMCS Cron Status | Shows whether the WHMCS AfterCronJob hook ran recently |
Copy the Cron URL and add it to your server cron:
*/5 * * * * curl -s "https://yourwhmcs.com/index.php?m=UptimeMonitor2&action=cron&token=..." >/dev/null
Tip
Regenerate the cron token periodically or after suspecting the URL has been exposed.