
Overview
About Uptime Monitor 2
This page is the product overview for WHMCS administrators. Uptime Monitor 2 checks services on a schedule, publishes status pages, and records incidents. Optional extensions add multi-region checks and a standalone status site.
What Uptime Monitor 2 Does
Uptime Monitor 2 checks your servers, websites, and services at regular intervals and shows the results on public or private status pages. It alerts your team and clients when services go down, tracks incidents over time, and lets subscribers receive email notifications automatically.
Key Features
Monitoring Engine
- HTTP / HTTPS monitoring — checks response codes, response time, SSL expiry, and keyword presence in the response body
- TCP port monitoring — verifies that a port is open and accepting connections
- Ping (ICMP) monitoring — measures basic reachability and round-trip time
- Heartbeat monitoring — services ping the monitor URL themselves; the system raises an alert if no ping is received within the expected window
- Configurable check interval (default 5 minutes), timeout, retry count, and fail-streak threshold before marking a service as down
Status Pages
- Create multiple status pages — one per product, brand, or customer segment
- Public, client-area, or password-protected access levels
- Standalone URL support (root-level
status.php) via the Status Page Pro extension - Custom logo, custom CSS, and section grouping per page
Incidents & Announcements
- Publish and manage incidents with severity levels (Critical, Major, Minor, Info) and state transitions (Investigating → Identified → Monitoring → Resolved)
- Add timeline update posts to each incident
- Link affected monitors to incidents
- Announcement bar with four styles (Info, Warning, Danger, Success) and optional expiry
Notifications
- Email alerts to page subscribers and to admin-defined channels
- Webhook support for integrations with Slack, Discord, and any HTTP endpoint
- Telegram bot notifications
- Escalation rules: trigger additional channels if a service remains down for a configurable number of minutes
Extensions
| Extension | What it adds |
|---|---|
| Multi-Region | Distributed agent checks from multiple geographic locations |
| Status Page Pro | Standalone status page, custom domain, advanced branding |
Administration
- Centralized admin panel inside WHMCS (
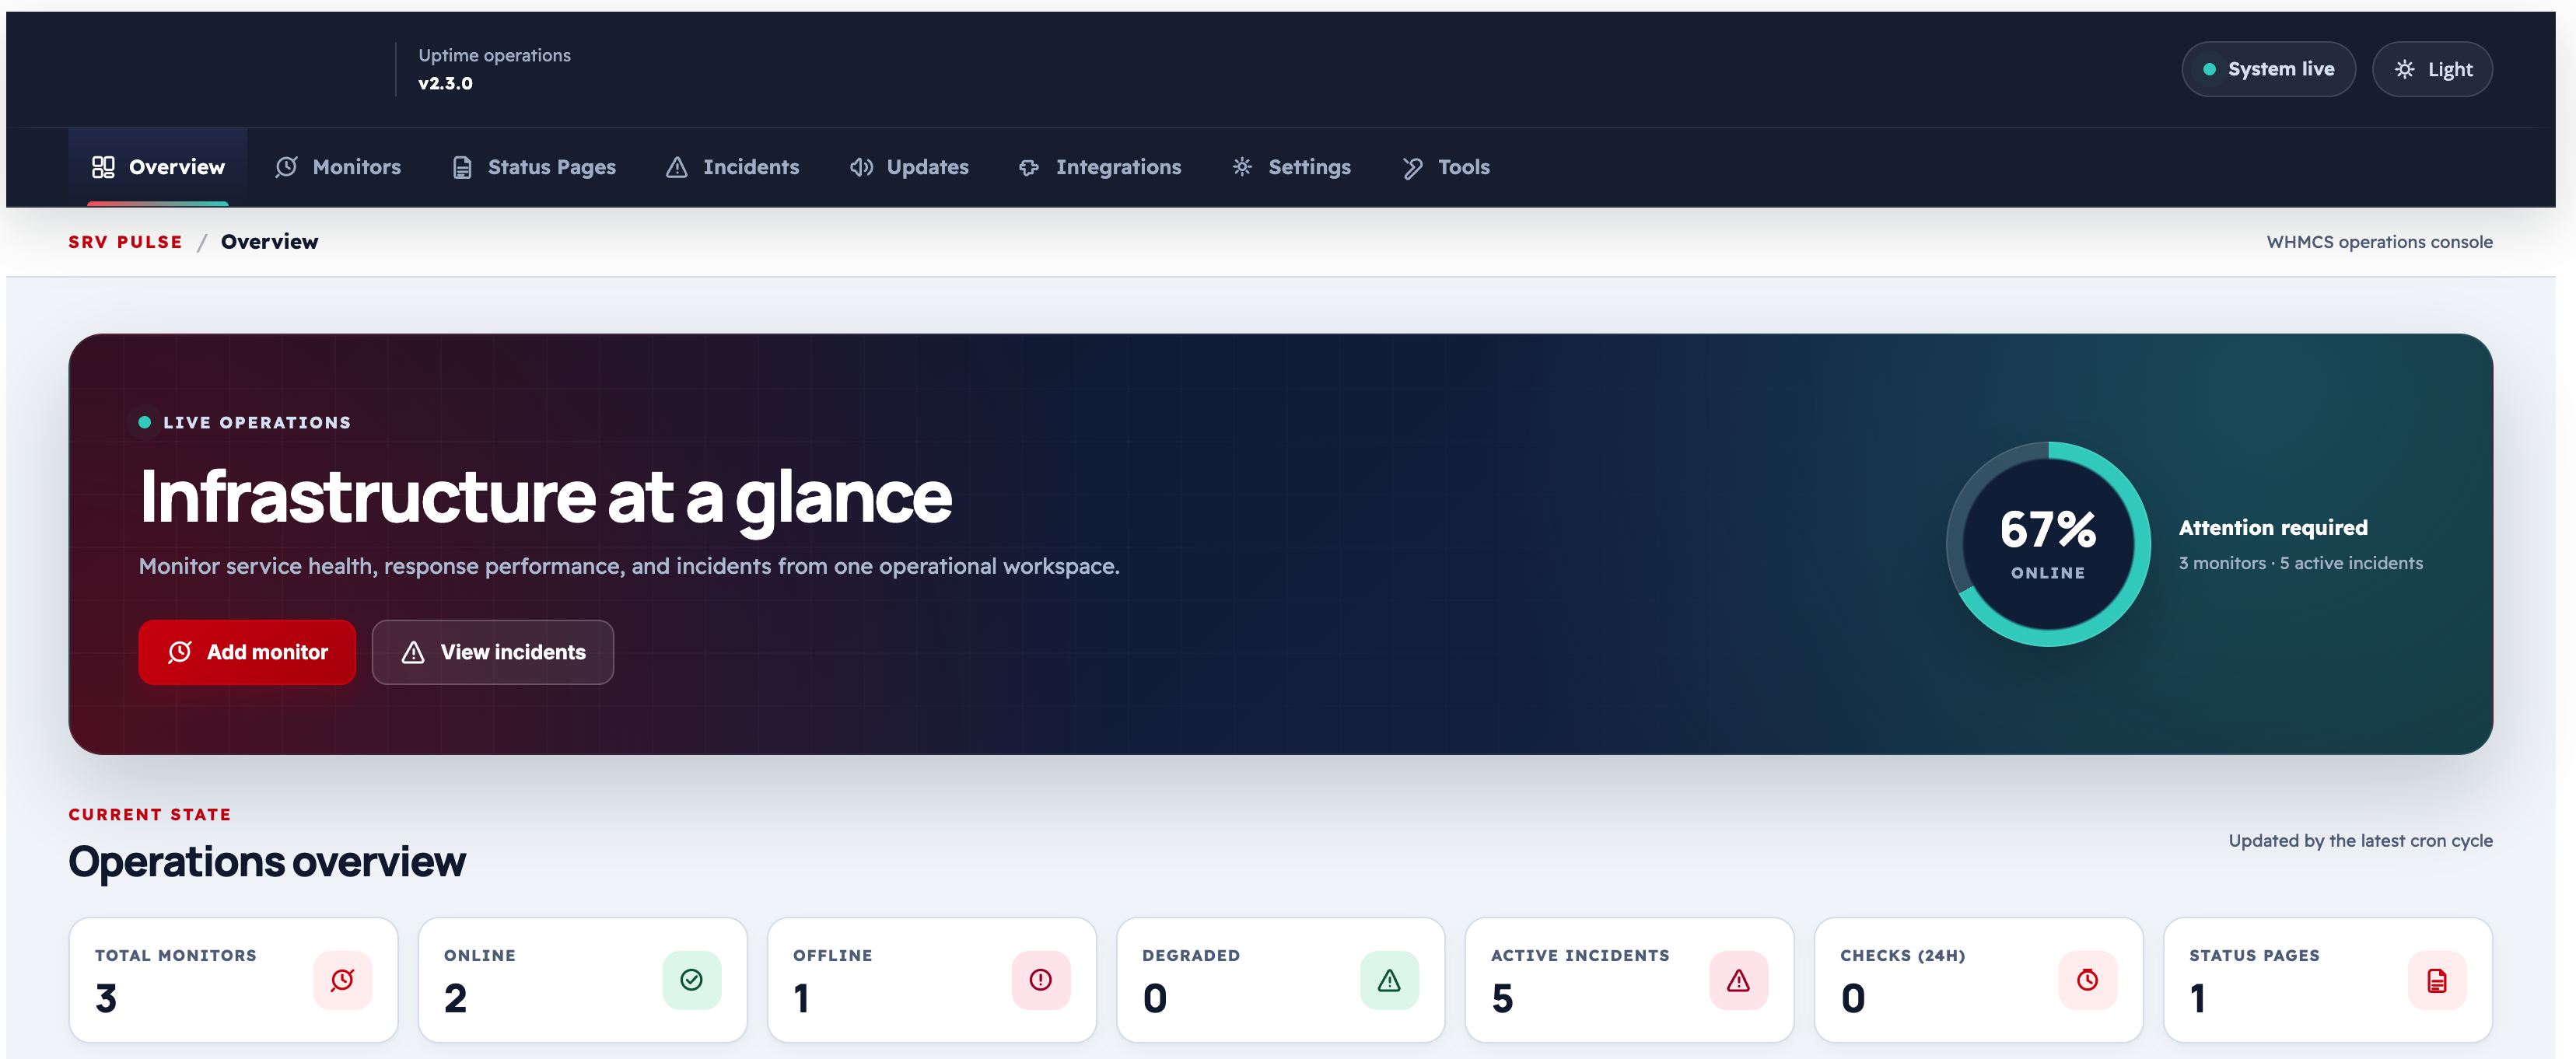
Admin → Addons → Uptime Monitor 2) - Live dashboard with KPI cards: total monitors, up/down/paused counts, recent incidents
- Retention policies for check history and the activity log
- Tools: force-run all checks, purge old results, view database statistics
- System diagnostics: PHP extensions, WHMCS version, cron status
Architecture Overview
WHMCS Admin Panel
└── Uptime Monitor 2 Addon
    ├── Monitoring Engine (cron-driven, PHP + optional Python agent)
    ├── Status Pages (public / client-area / standalone)
    ├── Notification Queue (email / webhook / Telegram)
    ├── License System (ServLayer Licensing 4th generation)
    └── Extensions
        ├── Multi-Region (distributed agent checks)
        └── Status Page Pro (standalone status pages)
The addon is driven by the WHMCS cron job (AfterCronJob hook) and by an optional external cron URL. Distributed monitoring agents (PHP or Python scripts) can be deployed on remote servers and submit results back to the main installation.
System Requirements
| Requirement | Minimum |
|---|---|
| WHMCS | 9.0 or later |
| PHP | 8.2 or later |
| PHP Extensions | curl, json, mbstring, openssl |
| Database | MySQL 5.7+ / MariaDB 10.3+ |
| WHMCS Cron | Must run at least every 5 minutes |
| License | Active key with prefix SRV-UM2-, verified at www.uni-art.io |
Tip
The addon installs and upgrades its own database tables automatically on activation — no manual SQL is required.
Note
PHP APCu is optional. It caches license and page data. The addon still runs without it.
Related pages
- Install the addon.
- Complete the post-install checklist.
- Follow first steps.