
Guide
Nodes List
This page is the live Proxmox node inventory. It is written for the operator checking capacity before a sale.
Menu: Addons → Proxmox Suite → Nodes → Nodes List
Purpose
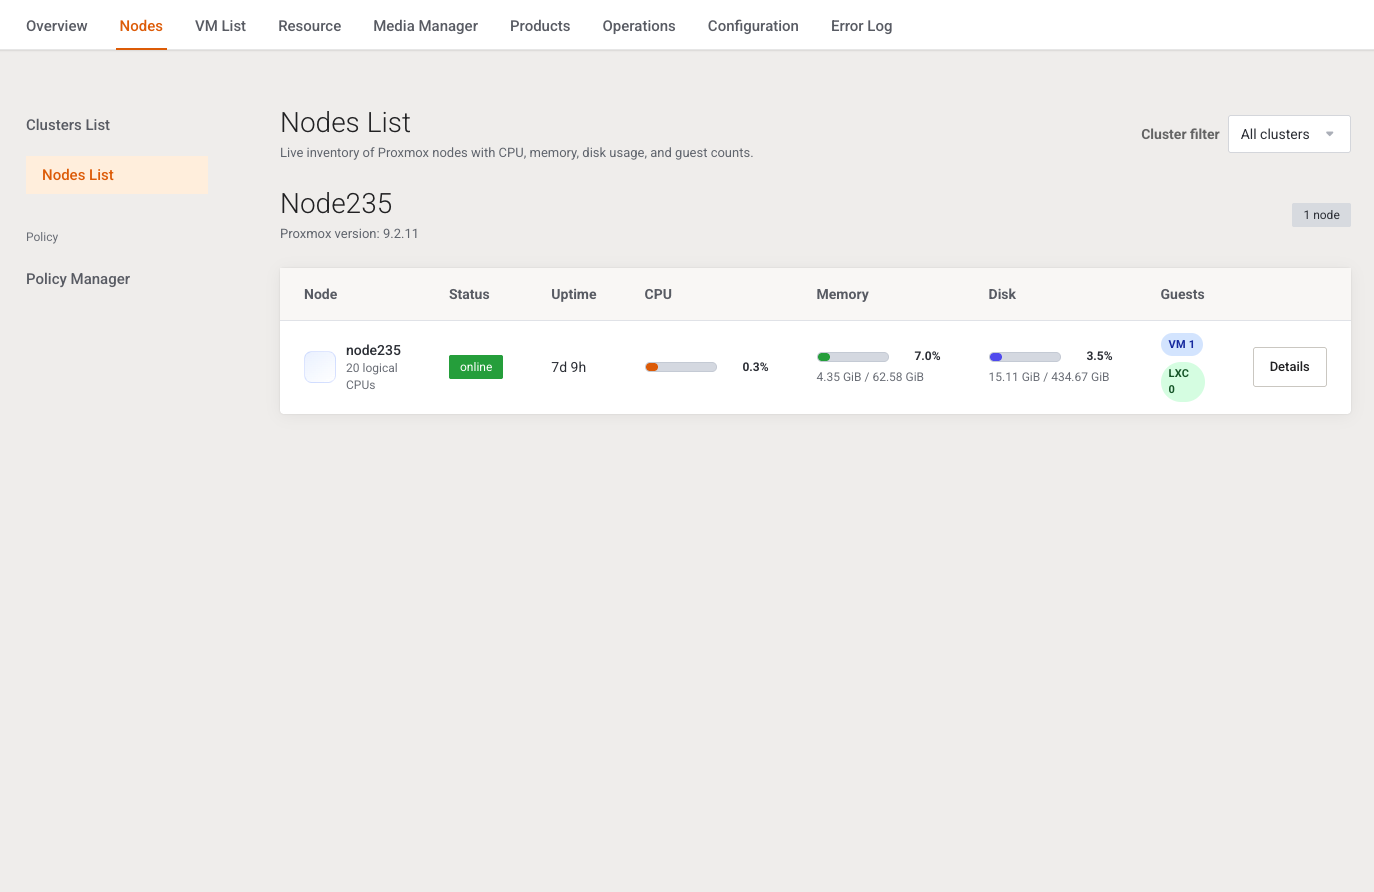
The list reads Active clusters only. It shows CPU, memory, disk, and guest counts. Nothing on this page is saved.
Intro: Live inventory of Proxmox nodes with CPU, memory, disk usage, and guest counts.
If there is no active cluster: No active clusters configured. Add a cluster under Nodes → Clusters List.
Filters
| Field | Type | What it does |
|---|---|---|
| Cluster filter | Select, submits on change | All clusters, or one active cluster. Opening details for another cluster drops the detail panel. |
Each cluster block shows Proxmox version and a node-count badge. An API error is a danger alert. A cluster that returns no nodes shows No nodes returned for this cluster.
Columns
| Column | What it shows |
|---|---|
| Node | Node name, logical CPU count, and Proxmox level when present |
| Status | Raw status. online is success styling; anything else is danger styling. |
| Uptime | Formatted uptime |
| CPU, Memory, Disk | Live usage bars. Memory and disk also show used and max. |
| Guests | VM count and LXC count |
| Details | Opens the node panel |
Node details
Details loads one node. Close returns to the list and keeps the cluster filter. The panel is display-only.
It shows Node details, the cluster name, Role, status, Uptime, PVE version, VM, LXC, Resource utilization (CPU, Memory, Disk, and Swap when Proxmox reports it), Hardware (CPU model, Logical CPUs, CPU cores, CPU frequency), and Runtime (CPU, Load average, Proxmox version).
Example
After Health succeeds on a cluster, open Nodes List with All clusters. An online node with a memory bar means the token can read node status. Empty bars after a good health check usually mean the catalog or the node API call failed; read the danger alert on the cluster block.
Next step
Create a distribution policy once nodes are visible.